NBA Challenge Rewind: A deep dive into advanced NBA metrics with dbt™
Discover István's insights, data modeling best practices, and his experiences in Paradime's 'NBA Data Modeling Challenge.'

István_Mózes
Jun 13, 2024
·
5
min read

Welcome to the "NBA Challenge Rewind" series 🙌
This blog series will showcase the “best of” submissions from Paradime’s NBA Data Modeling Challenges, highlighting the remarkable data professionals behind them.
If you’re unfamiliar with the NBA Data Modeling Challenge, enrich your series experience by exploring these essential resources: the challenge introduction video and the winner’s announcement blog. They offer valuable background information to help you fully appreciate the insights shared in this series.
In each "NBA Challenge Rewind" blog, you’ll discover:
Key NBA insights: Uncover the valuable insights participants derived from historical NBA datasets, revealing hidden stories within the game.
Analytics Engineering best practices: Learn about the participants' approach to project execution, from initial analysis to final insights, including their coding techniques (SQL, dbt™) and the innovative use of tools (Paradime, Snowflake, data visualization).
A Personal Touch: Get to know the motivations, backgrounds, and personal narratives of the analytics professionals who bring the NBA data to life.
A personal invitation to Paradime's next challenge: We're moving from the basketball court to the cinema—get your popcorn ready! 🍿
Let’s check out our next installment, exploring István Mózes and his submission!
István's path to the challenge
Hey! I’m István, a Senior Analytics Engineer at Munch. I'm based in Budapest, Hungary and have been immersed in the world of Data and Analytics Engineering for over six years. It’s been an exciting journey, and I’m eager to continue pushing the boundaries in this dynamic field.
Since childhood, my love for basketball, particularly the NBA, has been unwavering. Playing and avidly watching the sport has fueled my passion. For some time, I've contemplated merging this passion with another love of mine—data. This challenge presented the perfect opportunity and served as the ideal motivation to finally kickstart this long-awaited idea.
Going into the challenge, my goal was simply to dive into NBA data and construct some insightful data models. Winning a prize didn't even cross my mind, but I ended up taking 3rd place, winning a $500 Amazon gift card! On top of that, I was thrilled at the opportunity to experiment with some new data tools.
Toolkit for success
The challenge required leveraging Snowflake for data warehousing and Paradime for developing SQL queries and dbt™ models. Even though Snowflake and Paradime were new to me, my solid grasp on SQL and dbt™ principles helped bridge that gap quickly. The user-friendly interface and efficient workflow of Paradime, in particular, enabled me to adapt swiftly and make significant progress.
For visualizing the data, I explored Sigma for the first time. I found Sigma intuitive to learn, and it played a crucial role in effectively showcasing my analytical findings.
Building my project
The initial phase of my project involved deep analysis and brainstorming to uncover actionable insights from the NBA's historical data here. This process led me to focus on key statistics using SQL and dbt™ in Paradime:
Offensive Efficiency - This statistic quantifies a team's scoring ability per 100 possessions, offering an insightful measure of offensive prowess, enabling a standardized comparison across teams with differing game paces.
Defensive Efficiency - Measures a team's capability to limit the opposing team's points per 100 possessions, serving as a critical indicator of defensive strength and informing strategy enhancements.
Pace - Estimates the average number of possessions a team has per game, shedding light on how game tempo affects overall performance.
With these metrics as the foundation of my analysis, I was able to build an insightful project that both myself and the challenge judges found valuable.
Navigating challenges
Like any data project, this one had its share of roadblocks and challenges that needed resolution, including:
Developing Advanced Stats Formulas: Although formulas like Pace, offensive efficiency, and defensive efficiency were simple to understand, they were tedious to build. It required constant building and rebuilding until the calculations were consistently accurate.
Sourcing Additional Datasets: In order to complete some of my analyses, like Age of Freaks and Unicorns, I needed to bring in a new source data set, draft combine, which provides detailed physical measurements of players.
Data Quality Issues: A notable issue encountered was the quality of the data itself. Particularly, there were instances of missing data spanning back to the 1950s and 1960s for example, which necessitated careful consideration and handling during the analysis process and developing insights and conclusions.
Now that we've addressed the building process and challenges, let's dive into the insights I uncovered!
Insights Uncovered
Check out all my insights in my submission, but here are some of my favorites:
The rise of the Three-Pointer
This analysis demonstrates how the increase in three-point attempts has dramatically improved offensive efficiency throughout NBA history.
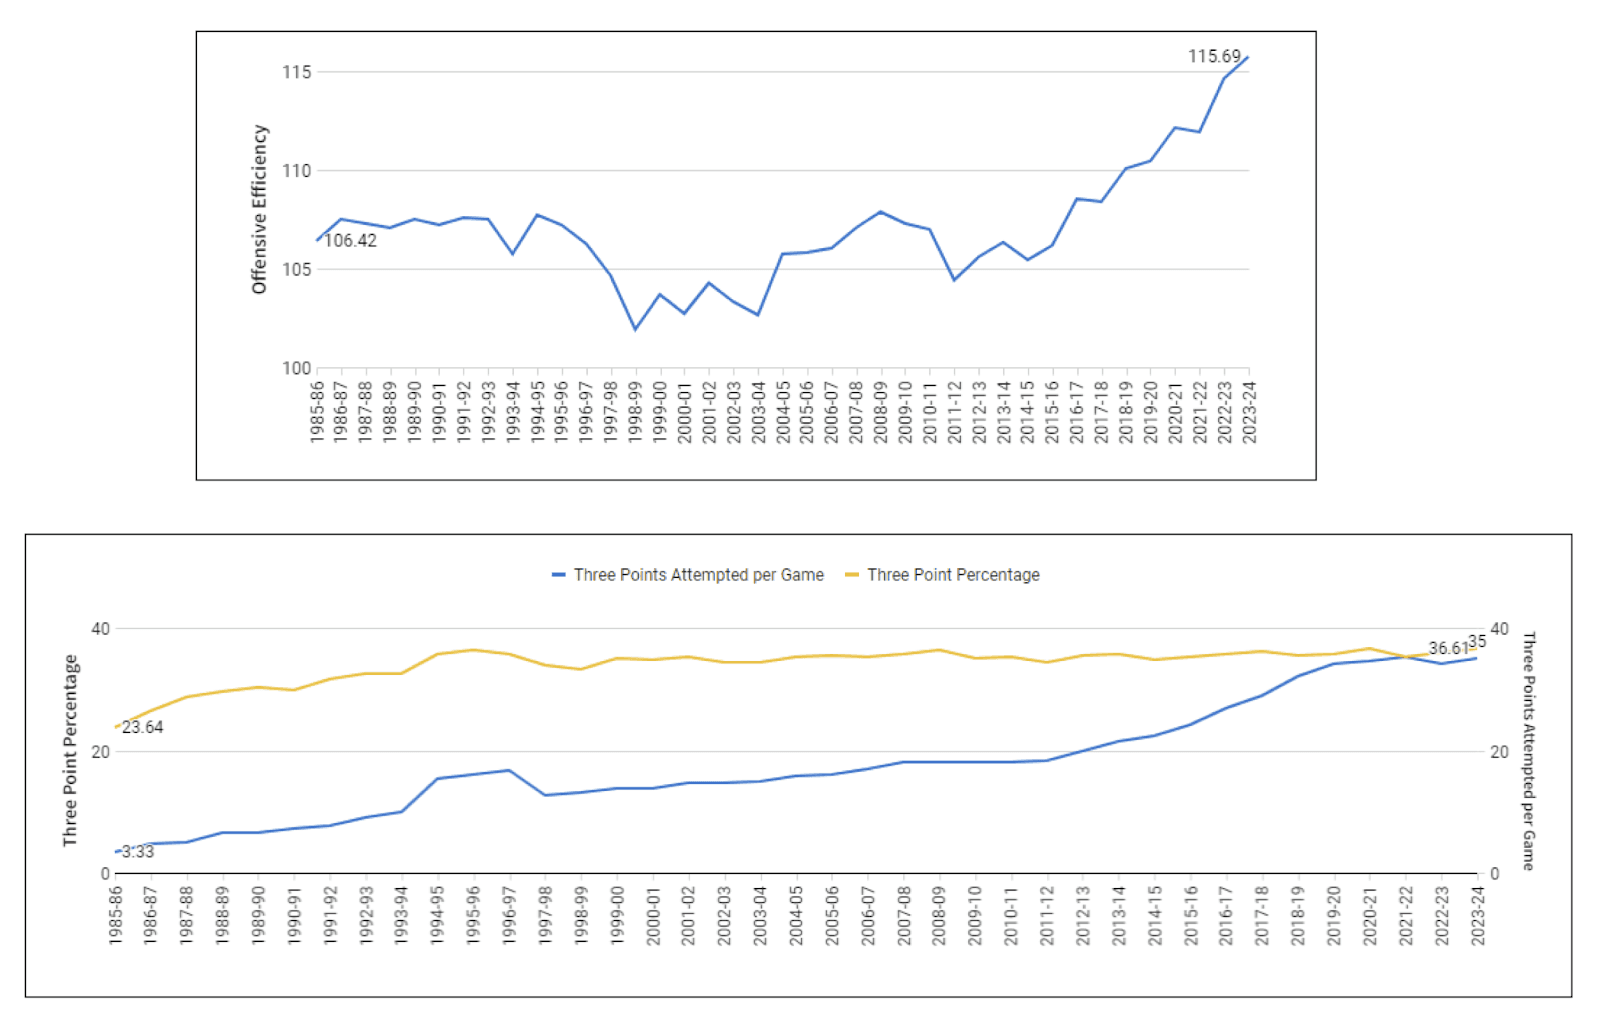
Insight: The graph detailing Offensive Efficiency by season reveals a league-wide increase in points per 100 possessions over the past 25 years, primarily driven by a surge in three-point attempts. This shift, illustrated in the Three-Point Attempts and Percentage graph, shows a rise from less than 10 three-point attempts per game 25 years ago to about 36 today, while the success rate for these shots has remained consistent. Consequently, this strategic change has led to increased points and enhanced offensive efficiency across the NBA.
Approach: In team_advanced_stats.sql, I implemented a possession calculation method to calculate possessions per game, alongside tracking three-point attempts and three-point percentage. I calculated offensive efficiency within the same SQL script by dividing each team's total points by their total possessions. Lastly, fct_aggregated_metrics_by_reg_szn.sql was used to average offensive efficiency, three-point attempts, and three-point percentage for seasons.
Three-Point Attempts by Position and Season
Average number of three-pointers a team attempts in a season split by positions. Positions were consolidated into three categories: guard, forward, center.
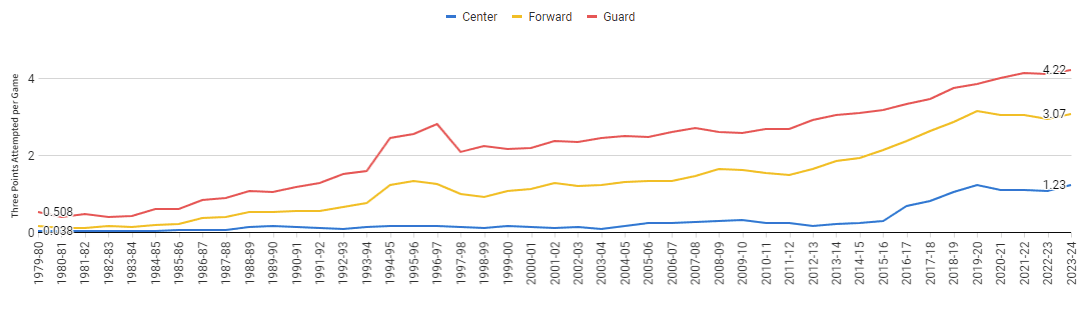
Insight: To fully understand the evolution of three-point shooting, analyzing it by player positions is crucial. Across all positions, three-point attempts have risen, but forwards and centers have seen the largest increases. In the 1983-84 season, guards averaged 0.43 three-point attempts per game, which increased to 4.22 by the 2023-24 season—a 9.81-fold rise. Forwards' attempts grew from 0.14 to 3.07, a 21.93-fold increase. Most notably, centers, who averaged only 0.03 attempts in 1983-84, jumped to 1.22 by 2023-24, marking a 40.67-fold increase.
Approach: I began with stg_player_game_logs.sql to identify three-point attempts for each player. Next, I joined this information with player positions from stg_common_player_info.sql to ensure precise player classification. Lastly, in fct_aggregated_metrics_by_reg_szn_position.sql, I averaged out three-point attempts by season and by position: Center, Forward, and Guard.
Number of players with 25+ points per game by season
Displays the number of players who have an average of 25 or more points per season.
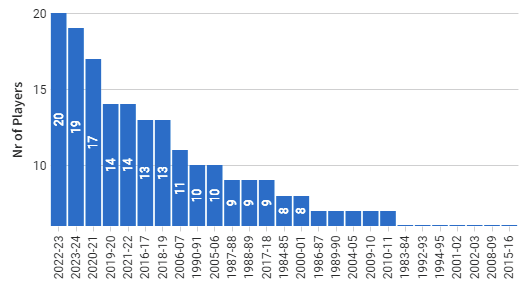
Insights: The recent NBA seasons have seen a significant trend: an increase in the number of players averaging 25+ points per game, with the last five years topping the list. This shift can be attributed to faster game paces, higher offensive efficiency, and a strategic focus on three-point shooting. These factors have not only changed the game's dynamics but have also made high-scoring performances more common. The graph highlighting this trend reflects how modern NBA strategies and player developments contribute to scoring growth.
Approach: By referencing stg_player_game_logs.sql, I identified points per game by each player in player_advanced_stats.sql. Next, I calculated the total count of 25+ points per game scorers and grouped them by season in fct_nr_of_25_plus_ppg_player_by_reg_szn.sql.
If you found these insights interesting, check out additional insights in my Github’s README.md!
Where to fo from here
My experience in the NBA Data Modeling Challenge not only honed my analytical skills but also deepened my understanding of how data shapes basketball strategies. Moreover, it was an exciting opportunity to compete and showcase my expertise in the field, particularly enjoying the chance to work with amazing tools like Paradime!
Looking forward, Paradime’s got something exciting on the horizon: a challenge centered around Movies data in April. It’s a shift from basketball to the big screen, and honestly, I can’t wait to see what we can uncover within movie datasets. There’s something special about diving into the numbers behind the stories we love on screen. So, if you’ve got a knack for data and love movies, this is your chance to explore, learn, and compete for the $500, $1,000, and $1,500 prizes!