Basketball by the numbers: Insights from Paradime's NBA Data Modeling Challenge
Learn about the NBA Data Modeling Challenge, the winners, and the insights uncovered by participants!

Parker Rogers
Jun 13, 2024
·
5
min read
Introduction
The final buzzer has sounded, and it's time to unveil the results of Paradime's NBA Data Modeling Challenge! This blog will guide you through the essence of the challenge, applaud the remarkable talents of our participants, and explore the breakthrough insights they've brought to light.
About Paradime's NBA Data Modeling Challenge
At Paradime, we're dedicated to empowering analytics engineers around the world. The NBA Data Modeling Challenge perfectly aligns with our mission, offering a platform for these experts to showcase their skills and compete for a $1,500 Amazon gift card.
This challenge taps into the vast and dynamic dataset of NBA statistics, providing an unparalleled playground for these professionals. It's an ideal setting for them to demonstrate their capabilities, discover new insights, and illustrate the impactful role that analytics engineering can play in organizations.
Challenge Overview
For those who missed it, we've outlined the challenge details in this video, but here's a quick summary:
The challenge was open to the public; anybody with experience in SQL, dbt™, and an interest in exploring NBA data could participate. Upon registration, participants gained access to:
Paradime for SQL & dbt™ development.
Snowflake for compute and storage, pre-loaded with seven historical NBA datasets.
Sigma for data visualizations.
A GitHub repository with pre-configured models to jumpstart their project.
The objective: Craft analyses using SQL and dbt™ that would captivate NBA fans and/or NBA general managers.
Participants had thirty days to build their project, after which a panel of five judges (myself included 👋) scored them independently to determine the top three winners.
Judging Criteria
Judging over 100 participants and 20 standout submissions was no small feat. Each submission showcased profound skills in SQL, dbt™ data modeling, analytics, and data storytelling.
We used the following criteria to fairly grade each submission:
Value of insights (1-10): How relevant are the findings for NBA fans and general managers?
Complexity of insights (1-10): Did the analysis reveal new dataset relationships and offer comprehensive conclusions?
Quality of materials (1-10): Were the code, visualizations, and insights presented to a professional standard?
Bonus points (1-3) for Integrating new data and leveraging additional Paradime features like Data Lineage and Data Catalog.
After thorough deliberation and independent scoring, the judges and I reached a consensus on the top three winners of the challenge!
Celebrating Our Top Three Participants
While these three participants have taken the top spots, we extend our heartfelt congratulations to everyone who participated. Their work is exceptional, and we'll showcase it in the next section.
First place: Spence Perry (Sr. Data Analyst, Classy)
By unanimous judges' approval, Spence's submission won the big prize: a $1,500 Amazon gift card! Designed for basketball enthusiasts and analysts, his project excels in all three major judging categories: value, complexity, and quality.
Additionally, Spence integrated two unique data sources into his project: field goal tracking and player injury data. These data sources allowed him to generate insights that no other participants could, such as:
Super clutch-time performers (AKA players who excel in the final seconds of the game)
Second place: Chris Hughes (Analytics Consultant, Hughes Analytics)
Chris's project wowed the judges, earning him a $1,000 Amazon gift card!
Targeting NBA General Managers, he developed insights that could help NBA teams explore key questions, like:
In addition to using SQL and dbt™, Chris leveraged python to create insightful predictive models, like player salary predictions.
Third place: István Mózes (Sr. Data Engineer, Navis)
István's expertise in SQL and dbt™ modeling, combined with an extensive knowledge of NBA analytics made for a great submission, and earned him $500 Amazon gift card!
Using the provided data sets, István's built high-value metrics that required significant logic, such as:
Pace per game (offensive possession per game)
Offensive efficiency (points scored per 100 possessions)
Defensive efficiency (opponent points scored per 100 possessions)
Additionally, István's accompanying insights to these metrics were concise and accurate.
Now that we've sung the praises of our finalists, let's dive into some of the best insights from the competition!
Participant-driven discoveries: key insights from the NBA Data Modeling Challenge
In no particular order, here are insights that jumped off the judge's screens:
Behind the arc: a closer look at three-pointers
Author: Spence Perry (Sr. Data Analyst, Classy)
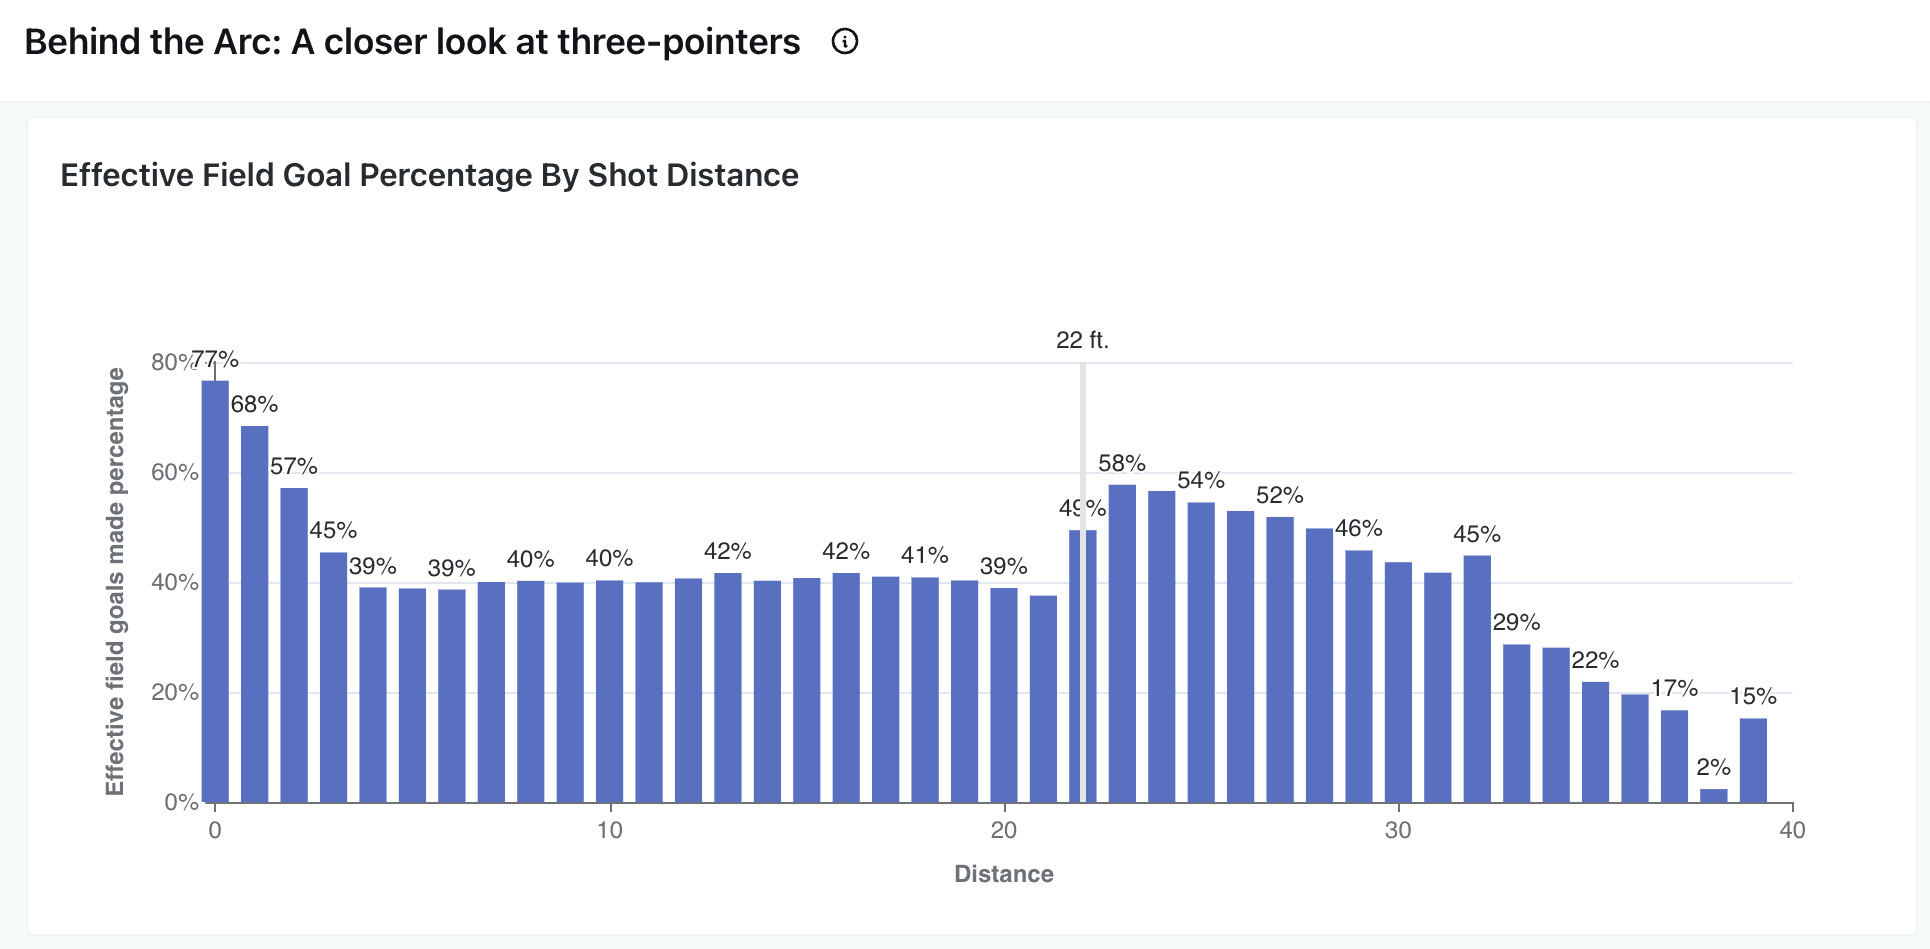
Insight: Through detailed data analysis, Spence suggests that if a player's field goal percentage is especially level between 21 ft (2-pointer) and 25 ft (3-pointer), they should attempt a 3-pointers instead. After all, "3 is greater than 2"!
Approach: Leveraging field_goals.sql in Paradime, Spence meticulously examined shot distance, field goal attempts, and field goals made.
2022-23 most overvalued players by salary difference
Author: Chris Hughes (Analytics Consultant, Hughes Analytics)

Insight: Chris's model pinpoints John Wall as the season's most overvalued player, suggesting a mismatch between his ~$47 million salary and actual performance. This insight aids general managers in making informed decisions about player contracts and team budget allocation.
Approach: Using player_salaries_by_season_adj.sql in Paradime and salary_prediction_model.py, Chris combined salary data with performance metrics to establish a model predicting fair compensation based on contribution, revealing potential budget inefficiencies.
Offensive efficiency per game by season + Three point attempts and three-point percentage by season
Author: István Mózes (Sr. Data Engineer, Navis)
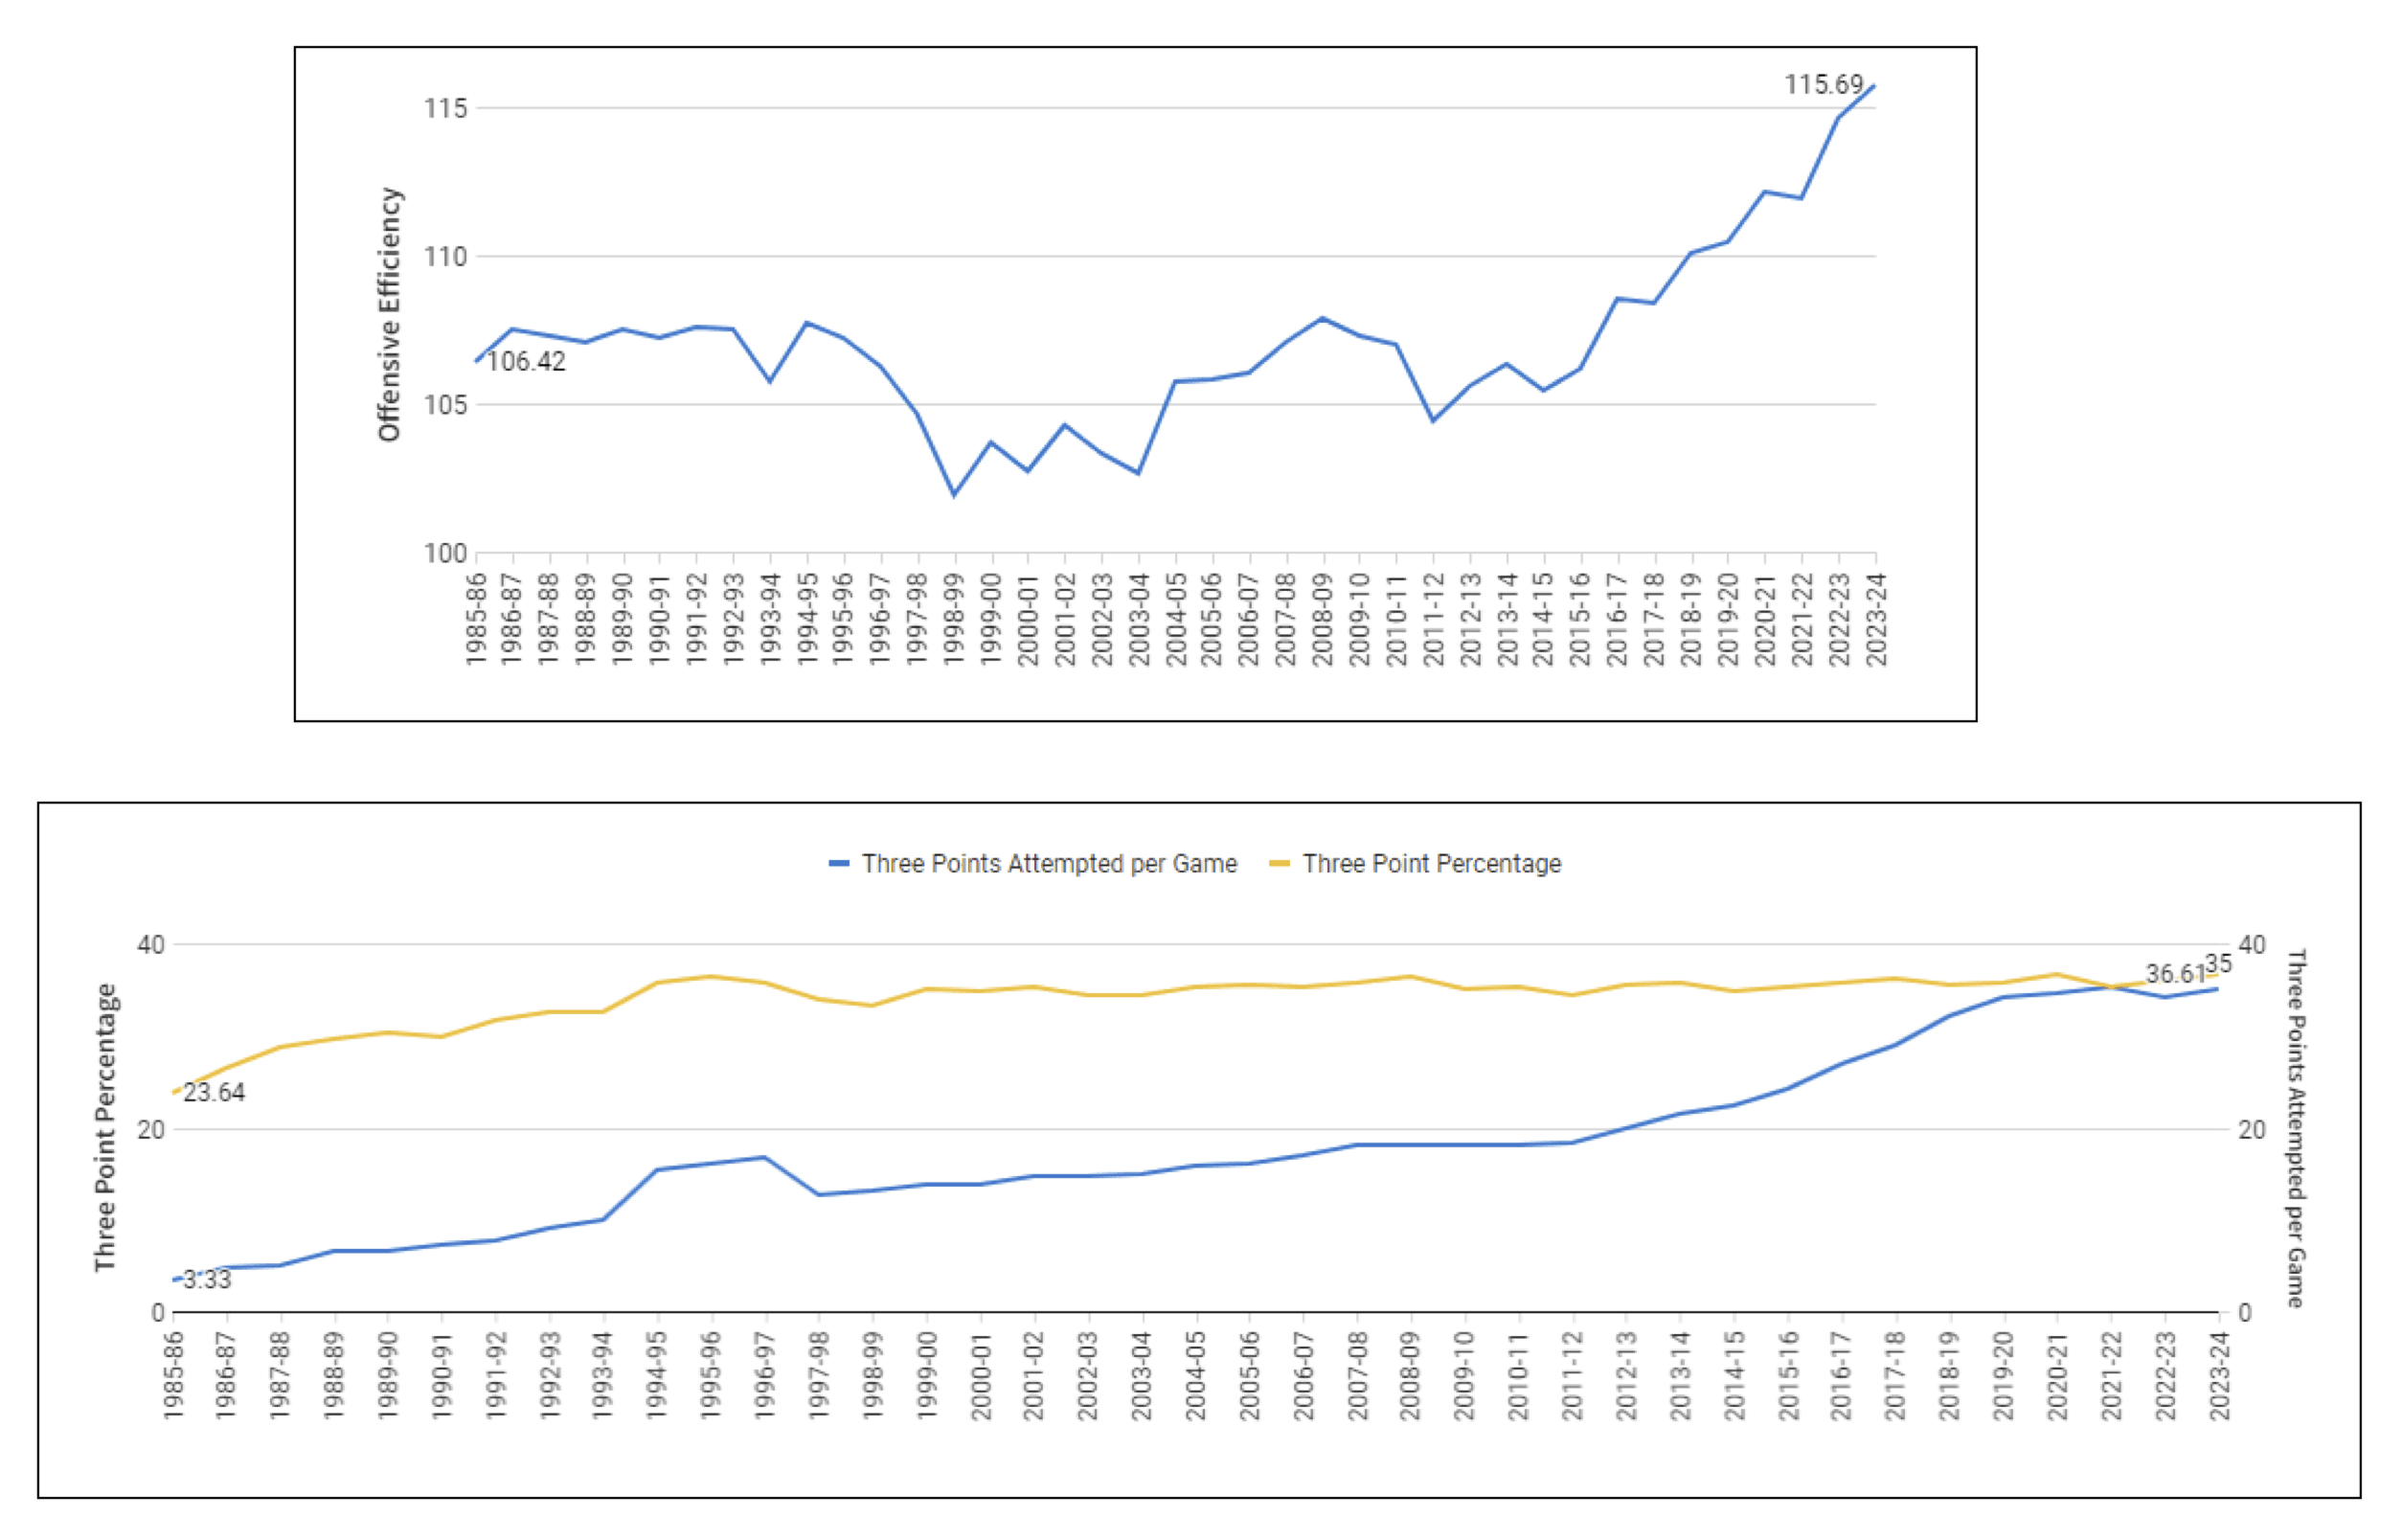
Insight: István correlates the rise in offensive efficiency to increased three-point shot attempts, encapsulating the "3 is greater than 2" philosophy's influence on scoring strategies.
Approach: Through team_advanced_stats.sql in Paradime, Mózes analyzed season-by-season data, illustrating how three-point shooting has evolved into a key factor for offensive strategies.
When do players reach their peak?
Author: Arin Tazler (Analytics Engineer, Pleo)

Insight: Arin's study reveals that players generally hit their performance peak around the 6th year of their careers, with an interesting exception for LeBron James, who defies the typical aging curve.
Approach: Using int_player_common_info_by_season.sql in Paradime, Arin evaluated players' points, rebounds, and assists to identify trends in performance peaks across careers.
Most consistent post-season performers
Author: Matthew Tribby (Sr. Data Engineer, OM1)
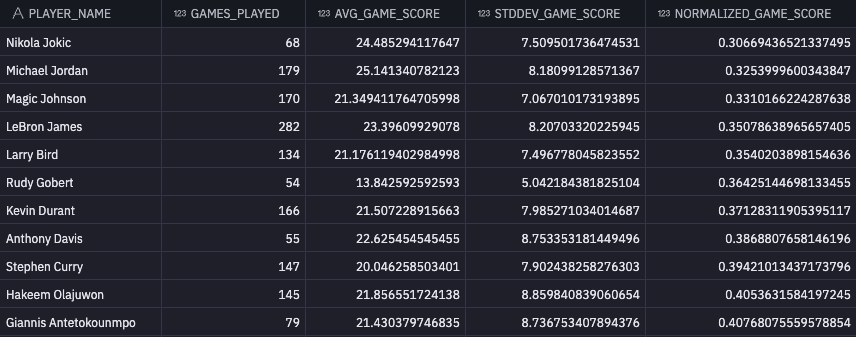
Insight: Matthew identifies Nikola Jokic as the most consistent performer in the postseason, even outpacing Michael Jordan, challenging conventional wisdom on playoff performance.
Approach: By analyzing stg_game_score.sql in Paradime, and incorporating a consistency calculation, Matthew showcases the remarkable reliability of Jokic's contributions under playoff pressure.
Win Share MVPs
Author: Iker Cámara Bengoechea (Data Scientist, Dreamdata)
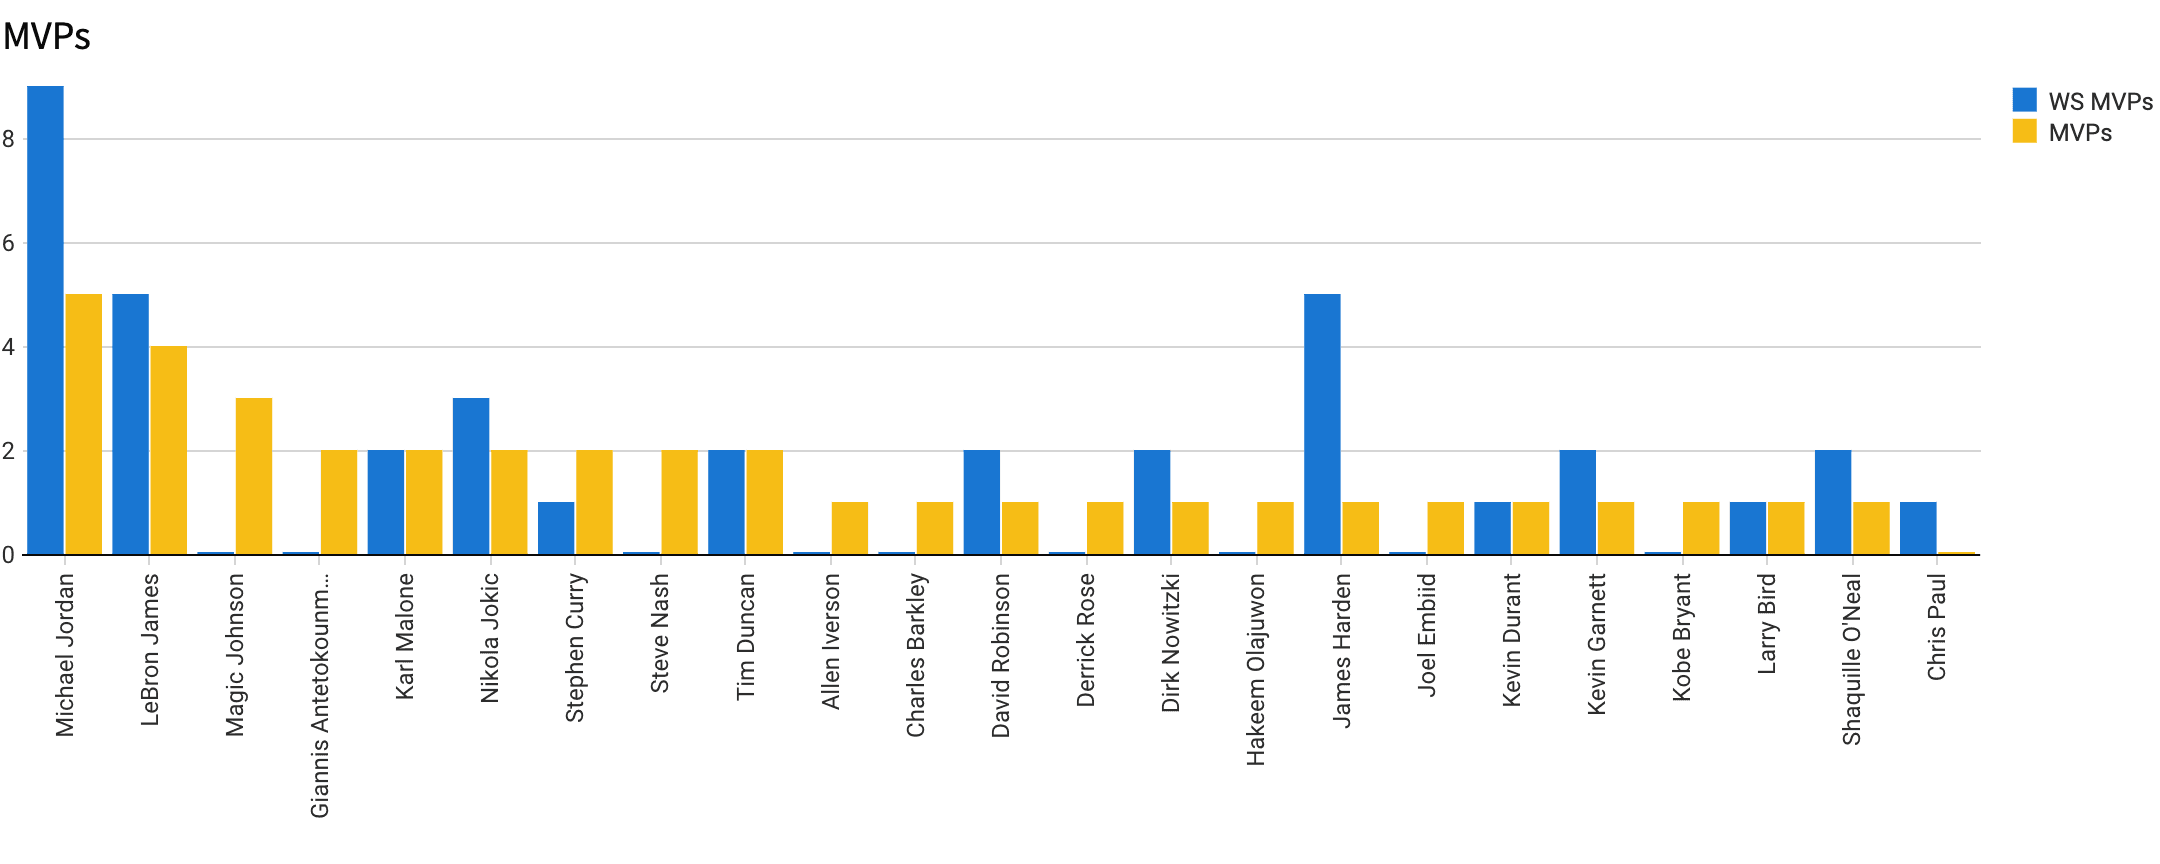
Insight: Iker's analysis proposes an alternative MVP awarding system based on "win shares", which would dramatically shift historical MVP awards, suggesting Michael Jordan would have won 9 MVPs.
Approach: Employing win_shares.sql in Paradime, Iker recalculated MVP awards, offering a fresh perspective on player value and contribution.
Top 10 inflation adjusted highest paid player career salaries (plus MJ)
Author: Cai Parry-Jones (Analytics Engineer, Sliide)
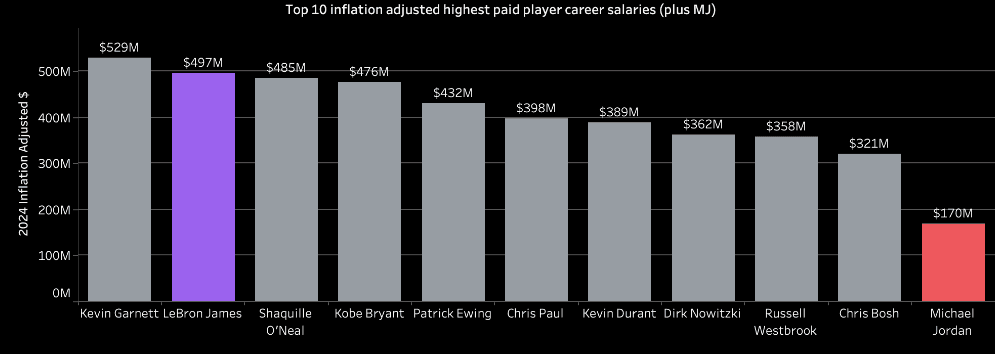
Insight: Cai's examination into career earnings, adjusted for inflation, suggests that while high salaries are impressive, they don't always correlate with being the greatest player, highlighting notable examples like Westbrook, Paul, and Bosh vs. Michael Jordan.
Approach: Through fct_player_career_performance.sql in Paradime, Cai provided a comprehensive look at the earning trajectories of NBA players, challenging perceptions of value and success.
"Super crunch time" leaders
Author: Spence Perry (Sr. Data Analyst, Classy)
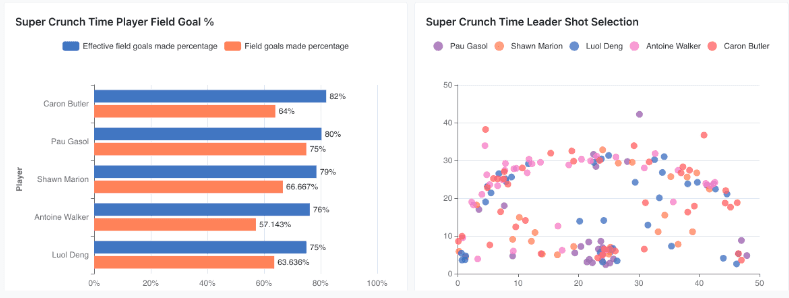
Insight: Revisiting Spence Perry's work, this analysis shines a light on players who excel in high-pressure, end-of-game situations, with Caron Butler leading in effective field goal percentage during crunch time.
Approach: Spence applied field_goals.sql in Paradime, to highlight players whose performance peaks when the game is on the line, offering insights into the psychology and strategy of clutch gameplay.
These insights are just a fraction of the remarkable work produced by our participants. For a deeper dive into their analyses, visit the paradime-dbt-nba-data-challenge repo and explore the diverse range of submissions!
Conclusion
That's the buzzer on our NBA Data Modeling Challenge, and what a game it's been! From the tip-off to the final play, we've seen analytics engineers bring their best, turning data into dazzling insights about basketball and beyond. This wasn't just about sports; it was a showcase of how analytics engineering can illuminate any field.
Big cheers to everyone who participated and shared their expertise. You've all demonstrated that with the right technical data skills, tools, and a bit of creativity, the possibilities are endless.
Curious about taking your analytics engineering game to the next level? Swing by Paradime to learn more about how our tools can help improve every aspect of your analytics engineering lifecycle!
And if you are looking to participate in the next challenge consider pre-registering so you know when we launch.


