NBA Challenge Rewind: Behind the arc - A closer look at 3 pointers
Discover Spence's insights, data modeling best practices, and his experiences in Paradime's 'NBA Data Modeling Challenge.'

Spence Perry
Jun 13, 2024
·
5
min read
Welcome to the "NBA Challenge Rewind" series 🙌
This blog series will showcase the “best of” submissions from Paradime’s NBA Data Modeling Challenges, highlighting the remarkable data professionals behind them.
If you’re unfamiliar with the NBA Data Modeling Challenge, enrich your series experience by exploring these essential resources: the challenge introduction video and the winner’s announcement blog. They offer valuable background information to help you fully appreciate the insights shared in this series.
In each "NBA Challenge Rewind" blog, you’ll discover:
Key NBA insights: Uncover the valuable insights participants derived from historical NBA datasets, revealing hidden stories within the game.
Analytics Engineering best practices: Learn about the participants' approach to project execution, from initial analysis to final insights, including their coding techniques (SQL, dbt™) and the innovative use of tools (Paradime, Snowflake, data visualization).
A Personal Touch: Get to know the motivations, backgrounds, and personal narratives of the analytics professionals who bring the NBA data to life.
A personal invitation to Paradime's next challenge: We're moving from the basketball court to the cinema—get your popcorn ready! 🍿
Now, let's dive into our next installment, featuring our first-place winner, Spence Perry, and his standout submission!
Spence's path to the challenge
Hey! My name is Spence Perry (he/him). I am a Senior Data Scientist at Classy/GoFundMe. I live in the Washington, DC metro area, and I have been working in data since 2020.
Recently, I had the opportunity to compete in Paradime’s most recent modeling challenge. The month-long competition tasked data professionals with transforming raw NBA data into insights for fans and general managers. After four tough weeks of pushing code and developing insights, I’m excited to share that I managed to win first place!
Discovering the NBA Data Modeling Challenge on LinkedIn, a part of me that loves diving into new domains and trying out cool tools was instantly energized, thinking, "Just do it!" Basketball isn't just a sport I love to watch; it was also the focus of my very first data analysis class, which used basketball analytics as an introduction to the vast world of econometrics.
This challenge was an unparalleled chance to immerse myself in data, offering a playful yet insightful exploration of basketball. Along the way, it also became a journey of discovery into new data tools and best practices, enriching my understanding and skills.
Toolkit for success
To tackle this challenge, I used a set of familiar and new data tools:
Snowflake for Data Warehousing and Computation:
Having used Snowflake on both personal and client projects for years, I navigated this tool with ease. Its user-friendly interface simplified the process of inspecting raw data and integrating my own data sources. Beyond its intuitive UI, Snowflake uses a flavor of SQL with lots of handy features. (Any QUALIFY fans out there?...IYKYK.).Paradime for dbt Development:
This was my first time using Paradime, and the learning curve was almost non-existent; I was up and running in minutes. It has all the features I have come to expect from cloud-hosted dbt platforms, complemented by top-notch features that can accelerate analytics work like data DinoAI and Paradime Radar.Lightdash for Data Visualization:
Choosing Lightdash was a no-brainer. It allowed me to define metrics right inside of the YML file of my dbt project, and Paradime’s built-in Lightdash integration made the setup simple. Having a single version-controlled codebase streamlined my workflow. Additionally, Lightdash has a focused set of visualization options that can help analysts avoid getting distracted by too many options that slow velocity for a marginal amount of added value.
Building my project
Here's how I structured my project:
Hitting the books
Before diving into SQL queries or Snowflake data exploration, I aimed to deepen my understanding of the vast world of NBA data and analytics. I immersed myself in books like Oliver Dean’s Basketball on Paper and Seth Partnow’s The Mid Range Theory. The depth of basketball analytics was mind-blowing; it's so rich that someone could potentially write a dissertation on a single player’s performance during just one quarter of play.
Identifying key questions
My thorough exploration led me to draft various questions that would be most interesting to NBA fans and general managers and serve as the backbone of my analysis, such as:
How has the evolution of the NBA's salary cap influenced team strategies, player distribution, and overall league dynamics?
How has the increasing reliance on three-point shots reshaped basketball strategy and player roles?
Who are the all-time greatest "super crunch time" players, and what does their shot selection reveal about high-pressure play strategies?
Data exploration
With a solid foundation in basketball analytics and my questions outlined, I turned to Snowflake to evaluate data quality. Here, I faced several hurdles, like missing game records and inconsistent player information. Realizing the existing datasets fell short of answering my inquiries, I incorporated additional data:
Data modeling and visualization
Armed with the requisite data and a clear roadmap, I proceeded to the final stages of my project—data modeling and visualization. This segment of the project entailed crafting insightful visualizations and models concurrently, culminating in an extensive analysis of basketball.
Now, let’s take a look at some of the insights I uncovered!
Insights uncovered
For a comprehensive exploration of my insights, visit the README.md in my GitHub repository. Here’s a summary:
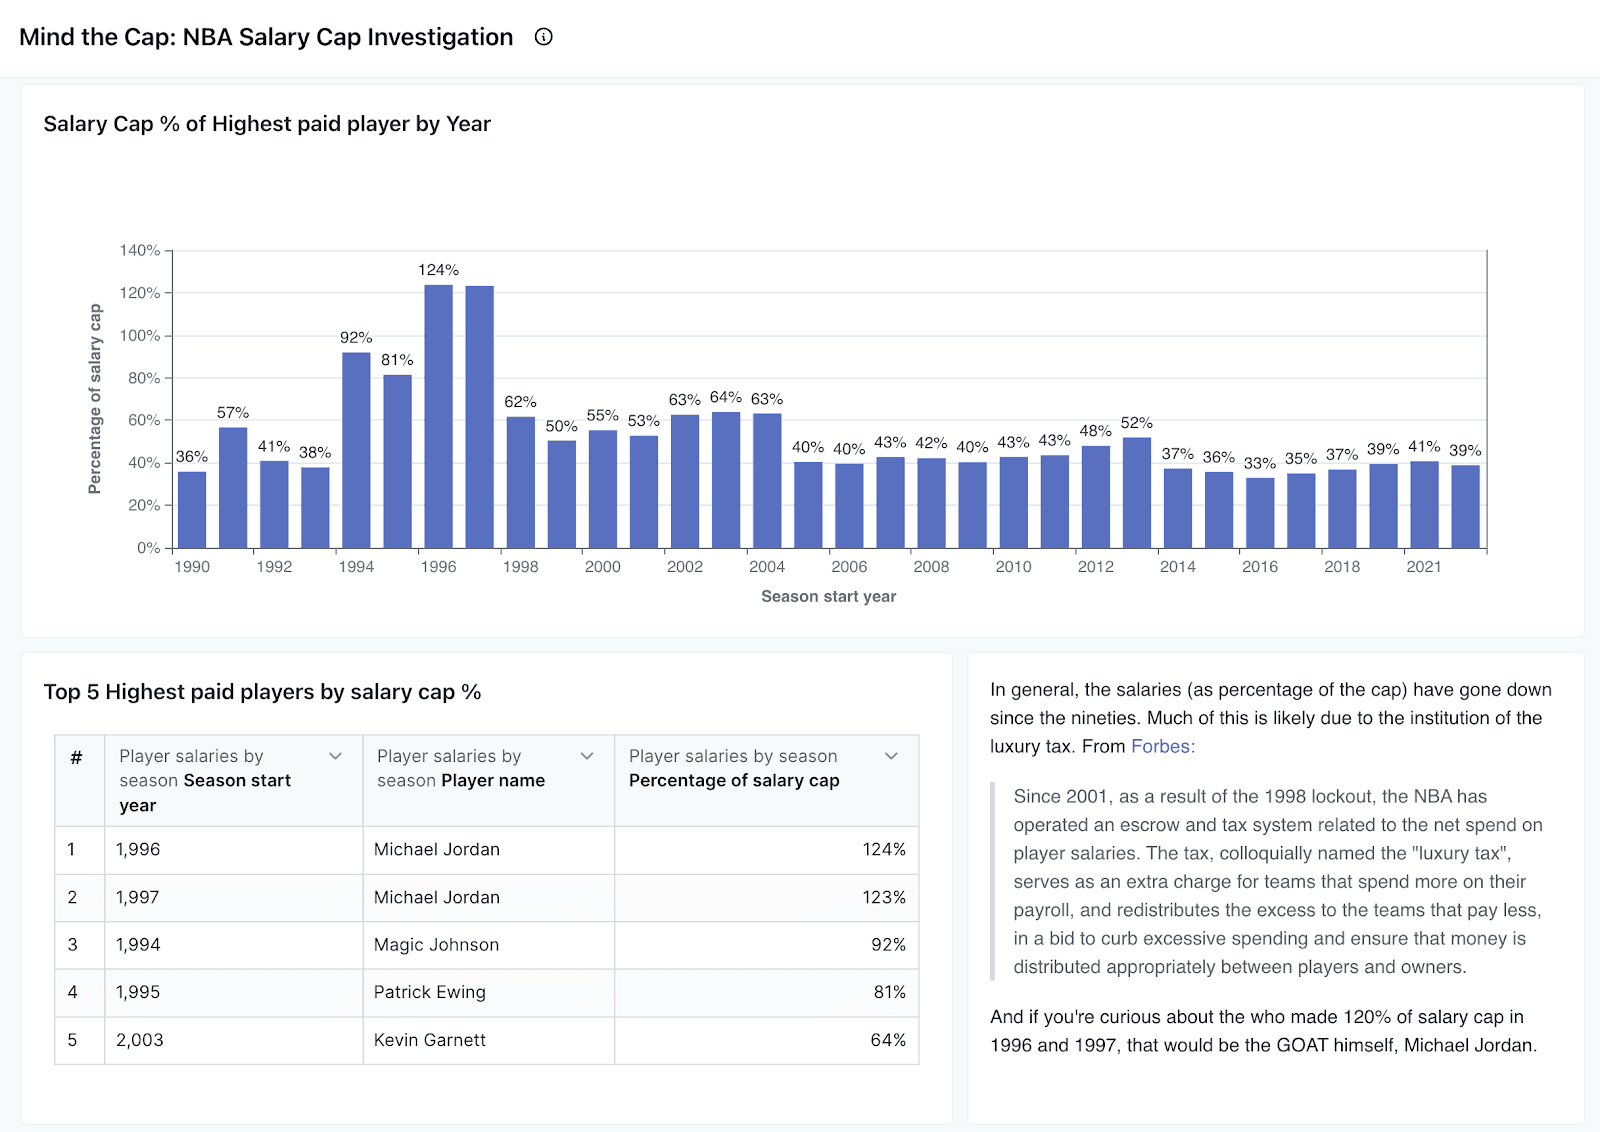
Mind the cap: NBA salary cap investigation
My exploration aimed to detail the NBA salary cap's evolution—a subject with significant consequences for team success, player distribution, and satisfaction. This comprehensive analysis examines key elements of the salary cap, such as:
Historical trends in the League Salary Cap since 1991, adjusted and not adjusted for inflation.
Annual allocation of the salary cap to the highest-paid players.
Plus/minus statistics comparison for the top 25 salaried players against others.
Spotlight on top-performing players earning below the median salary for the 2022-23 season.
Highlighted Insight: Salary cap % of highest paid player by year

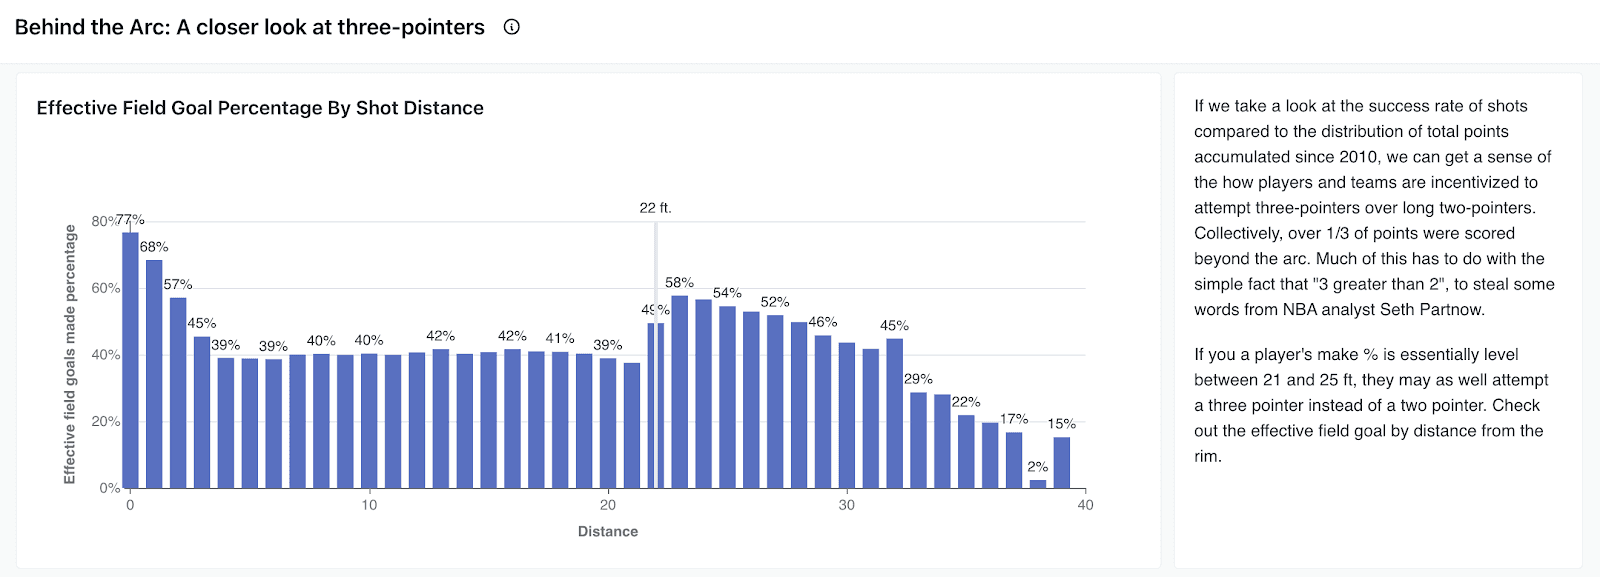
Behind the arc: a closer look at three-pointers
The surge of three-point shooting has been reshaping the game for over a decade. This analysis taps into field goal attempt data to uncover:
The yearly percentage of field goal attempts from behind the arc.
Effective Field Goal Percentage (EFG%) by shot distance
Breakdown of FG% and EFG% by player position since 2010.
Recognition of the top three-point shooters in league history.
Highlighted Insight: Effective Field Goal Percentage by Shot Distance

Every second counts: final moments in final quarters
While there are 48 minutes of regulation play, there is something different that happens for fans, coaches, and players alike in the final moments of a game. My investigation aimed to unravel the dynamics of what I've termed "super crunch time" – the intense last 5 seconds of the 4th quarter and overtime. My analysis from 2000 to 2020 dives into:
A yearly analysis of "super crunch time" shots and their distances.
Teams with the highest FG% and EFG% in late-game situations.
The all-time greatest "super crunch time" players, spotlighting their shot choices in these nail-biting moments.
Highlighted Insight: All-time greatest “Super crunch time” players.

Where to go from here
Overall, participating in Paradime’s NBA Data Modeling Challenge was an exhilarating and insightful experience that diverged significantly from my usual day-to-day work. This month-long journey was filled with valuable lessons, some tied to the realm of data and others to life itself. Personally, it was a battle against self-doubt, a packed schedule, and the pursuit of perfection. This competition became my opportunity to "shoot my shot." Win or lose, I learned to take pride in seizing the chance and giving it my all.
For those interested in my contributions to the fundraising data sphere, check out my posts on Classy’s blog, where I share insights alongside a talented team of GoFundMe data experts.
Looking ahead, Paradime is gearing up for an exciting new challenge focusing on Movie data this April. Transitioning from the basketball court to the cinema, I’m eager to delve into what movie datasets can reveal. If data analysis sparks your interest and you’re a movie enthusiast, this upcoming challenge offers a unique opportunity to dive deep, learn, and potentially win prizes ranging from $500 to $1,500!


