Feature Spotlight: Customizing your Radar Dashboards
Unlock the full potential of your Radar dashboards with powerful customization options designed to meet the needs of your data team.

Emelie Holgersson
Jul 10, 2024
·
1
min read
With Paradime Radar, we are giving analytics teams 60+ metrics out-of-the-box to measure, analyze, and improve their productivity.
Data leaders and analytics teams can finally get important insights on platform, team, and spend performance. With these crucial insights, teams can get a 360-view of the impact of their work and the value they bring to the organization.
Unlock the full potential of your Radar dashboards with powerful customization options designed to meet the unique needs of your data team. Dive into the two primary customization avenues.
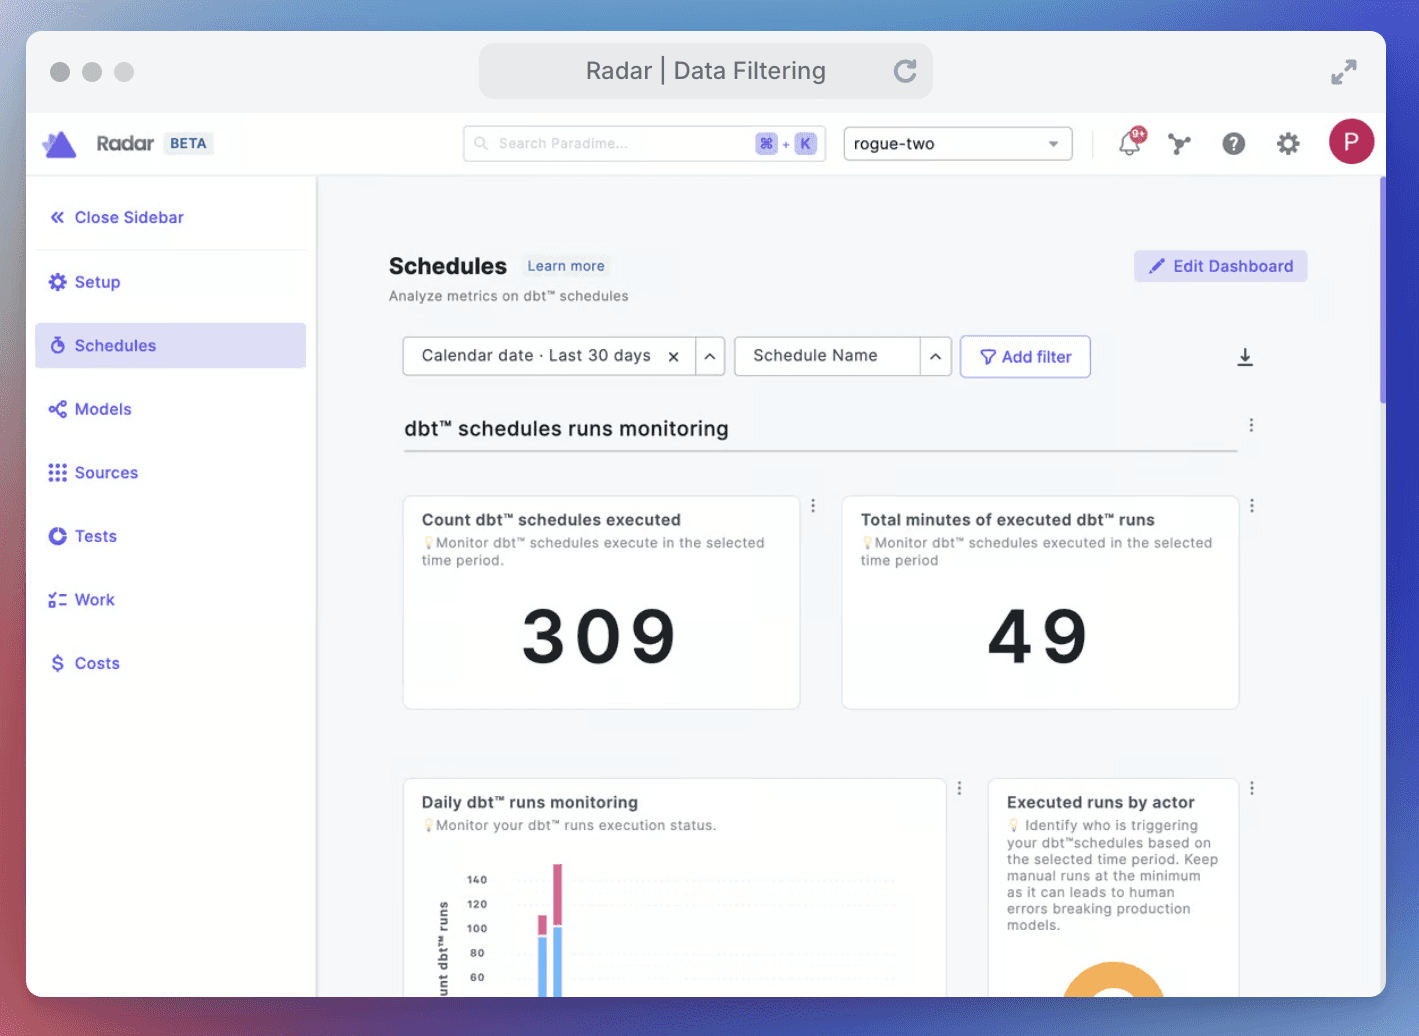
Data filtering
Radar dashboards offer precise data filtering capabilities, allowing your team to hone in on the metrics that matter most. Here's how you can tailor your data views:
Date Ranges: Focus on specific time frames to analyze relevant data periods and trends.
Field Values: Filter data by criteria such as Schedule Name, Test Name, and more to gain detailed insights.

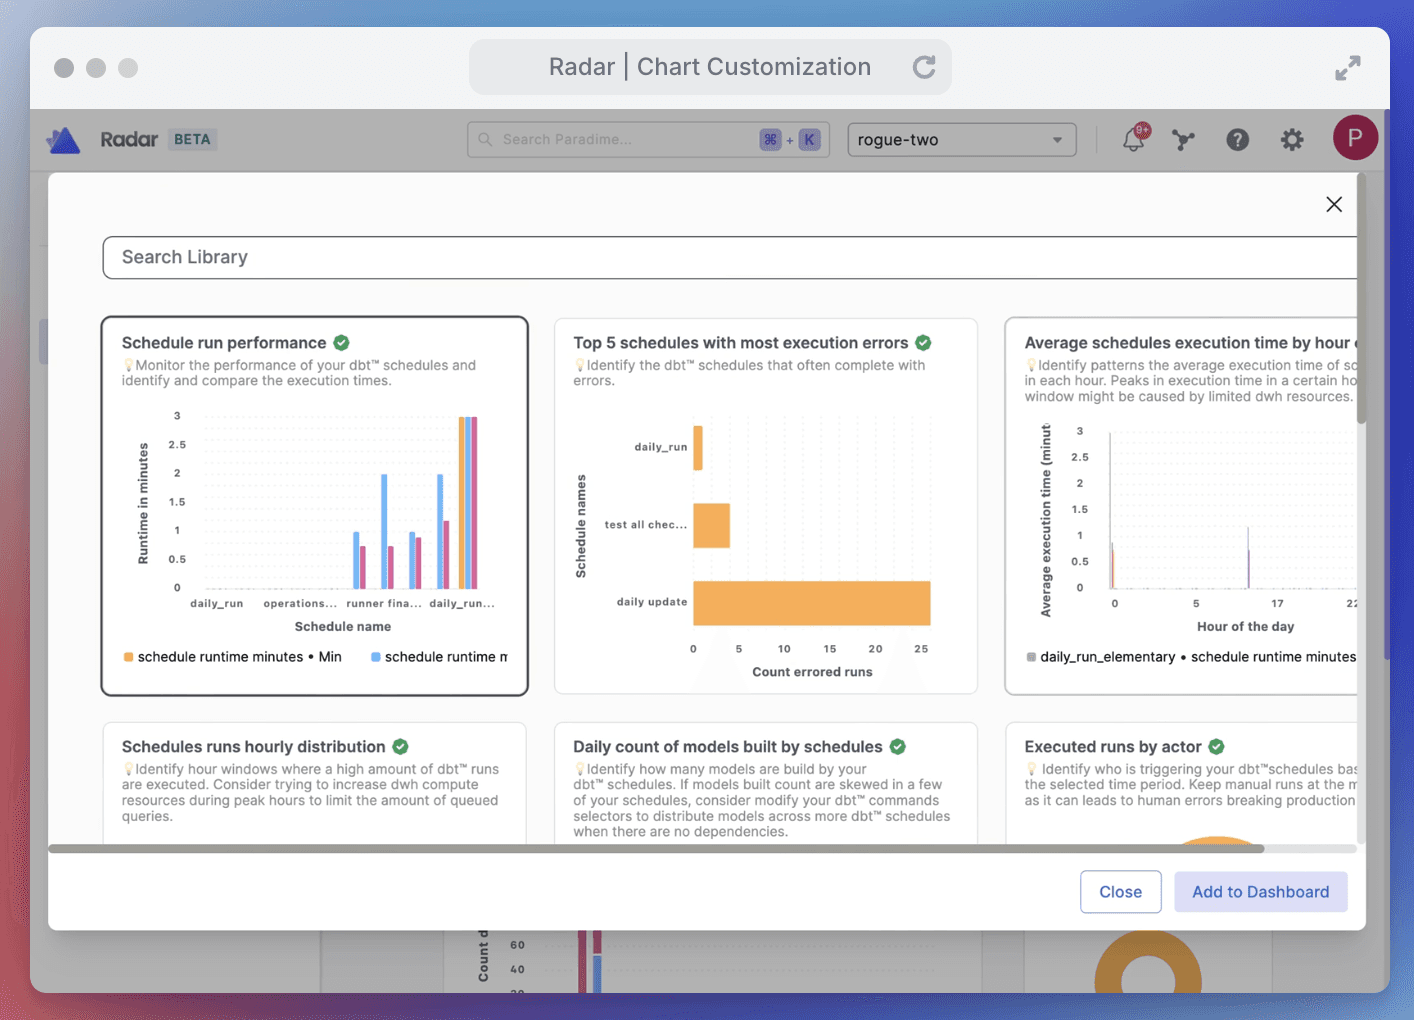
Chart customization
Elevate your dashboard's visual appeal and functionality with extensive chart customization options. Each element can be tailored to enhance data interpretation and meet your team's unique requirements. Customization features include:
Adjust chart sizes: Dynamically resize charts to optimize your dashboard layout for better readability and efficient use of space.
Rename charts and sections: Personalize chart and section names to accurately reflect the underlying data, improving navigability and relevance.
Add/edit chart headers: Update chart headers to clearly convey the essence of the data, enabling quick comprehension at a glance.
Add new charts: Enhance your dashboard's analytical depth by adding new charts, offering a broader spectrum of data visualization and insights.
By leveraging these powerful customization options, your data team can create dashboards that are not only visually compelling but also highly functional. These tailored dashboards will provide more efficient insight gathering and facilitate superior data-driven decision-making, empowering your team to achieve more.

Step-by-step tutorials are available to guide you through the data filtering process, ensuring you can efficiently refine your data views.


