NBA Challenge Rewind: Jordan or LeBron? dbt's 🐐 Analysis
Discover Cai's insights, data modeling best practices, and his experiences in Paradime's 'NBA Data Modeling Challenge.'

Cai Parry-Jones
Jun 13, 2024
·
5
min read

Welcome to the "NBA Challenge Rewind" series 🙌
This blog series will showcase the “best of” submissions from Paradime’s NBA Data Modeling Challenges, highlighting the remarkable data professionals behind them.
If you’re unfamiliar with the NBA Data Modeling Challenge, enrich your series experience by exploring these essential resources: the challenge introduction video and the winner’s announcement blog. They offer valuable background information to help you fully appreciate the insights shared in this series.
In each "NBA Challenge Rewind" blog, you’ll discover:
Key NBA insights: Uncover the valuable insights participants derived from historical NBA datasets, revealing hidden stories within the game.
Analytics Engineering best practices: Learn about the participants' approach to project execution, from initial analysis to final insights, including their coding techniques (SQL, dbt™) and the innovative use of tools (Paradime, Snowflake, data visualization).
A Personal Touch: Get to know the motivations, backgrounds, and personal narratives of the analytics professionals who bring the NBA data to life.
A personal invitation to Paradime's next challenge: We're moving from the basketball court to the cinema—get your popcorn ready! 🍿
Let’s kick off with our second installment, exploring exploring Cai Parry-Jones’ and his submission!
Cai’s path to the challenge
Hey there! I’m Cai, an analytics engineer at Sliide. I'm currently living in London but have aspirations of moving to the US someday (if they'll let me in! 🤣). My journey into data began seven years ago during my university days, and it evolved into a full-time career four years ago.
I discovered the NBA Data Modeling Challenge while exploring Paradime resources; my team and I use Paradime for all our analytics engineering work. It seemed like a perfect opportunity to improve my skills in dbt development, data modeling, and compete for some big prizes!
Toolkit for success
For this challenge, I used a set of tools I’m quite familiar with:
Paradime for SQL & dbt™ development
Snowflake for computing and storage
Tableau for data visualizations
Building my project
As with most data projects, I started out exploring the available data: historical NBA datasets, and answering questions such as: What tables do I have available to me? How much historical data do I have? What, if any, limitations are there in the datasets?
After exploring the data I came up with questions that this dataset could answer. I settled on a fan favorite: ‘Who is the best NBA player ever?” AKA “Who is the 🐐?”
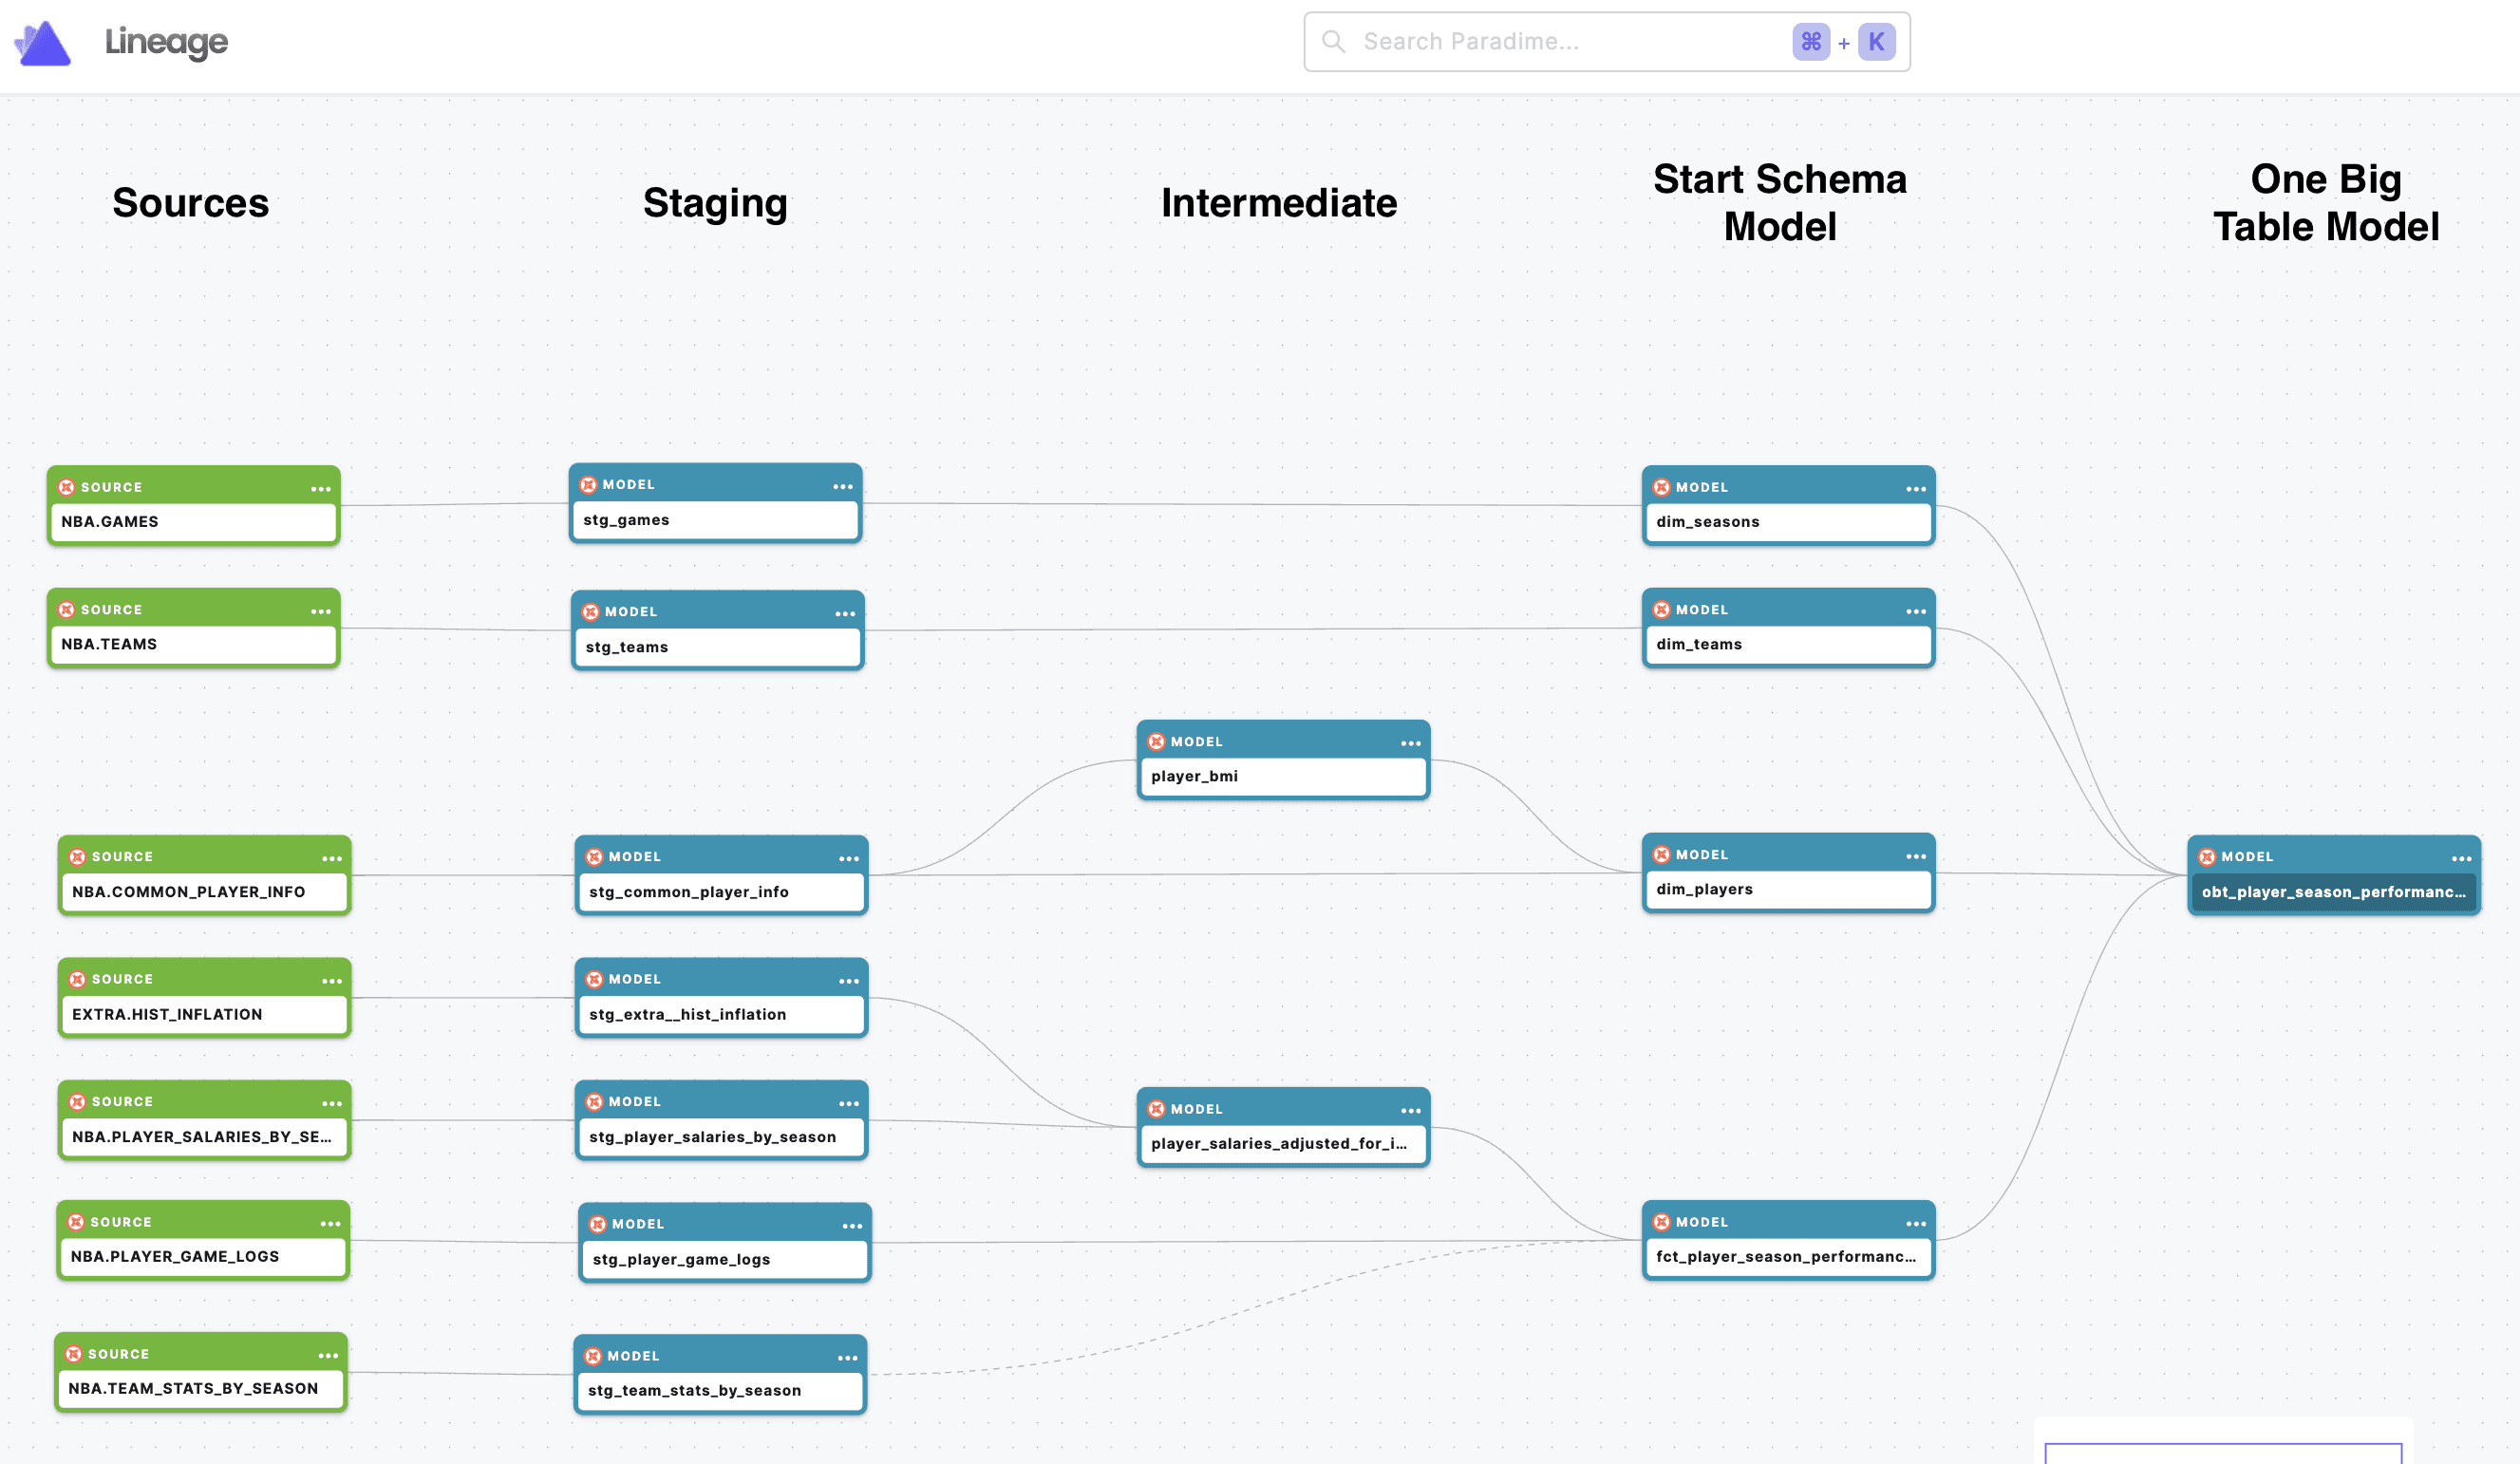
Before doing any SQL or dbt development, I took a pen to some paper. I wrote down the datasets required to answer my question, and how they relate to each other. I wanted to analyze players at a season level as well as a career level, so I settled on two crucial fact tables: fct_player_season_performances, and fct_player_career_performances, as well as three dimensions that can connect to both facts: dim_players, dim_teams, dim_seasons.
You can see my final results here.
Navigating challenges
During the early stages of dbt development, I found two challenges that demanded solutions, or at least workarounds.
Incomplete ‘Plus Minus’ data - This data was only available from the late 90’s onward, meaning that older players like Michael Jordan didn’t have this key metric for most of his career. To address this limitation, I noted its constraints in the plus-minus analysis and utilized other key metrics to identify the best players.
Misleading salary data - To identify the highest paid players in NBA history, I had to find a way to adjust all player salaries for inflation. I solved this by bringing in 3rd party inflation data and calculating inflation-adjusted salaries.
Insights uncovered
Player pay
The salary of players is a critical aspect of how players' teams value them, as well as more generally defining a player's personal success.
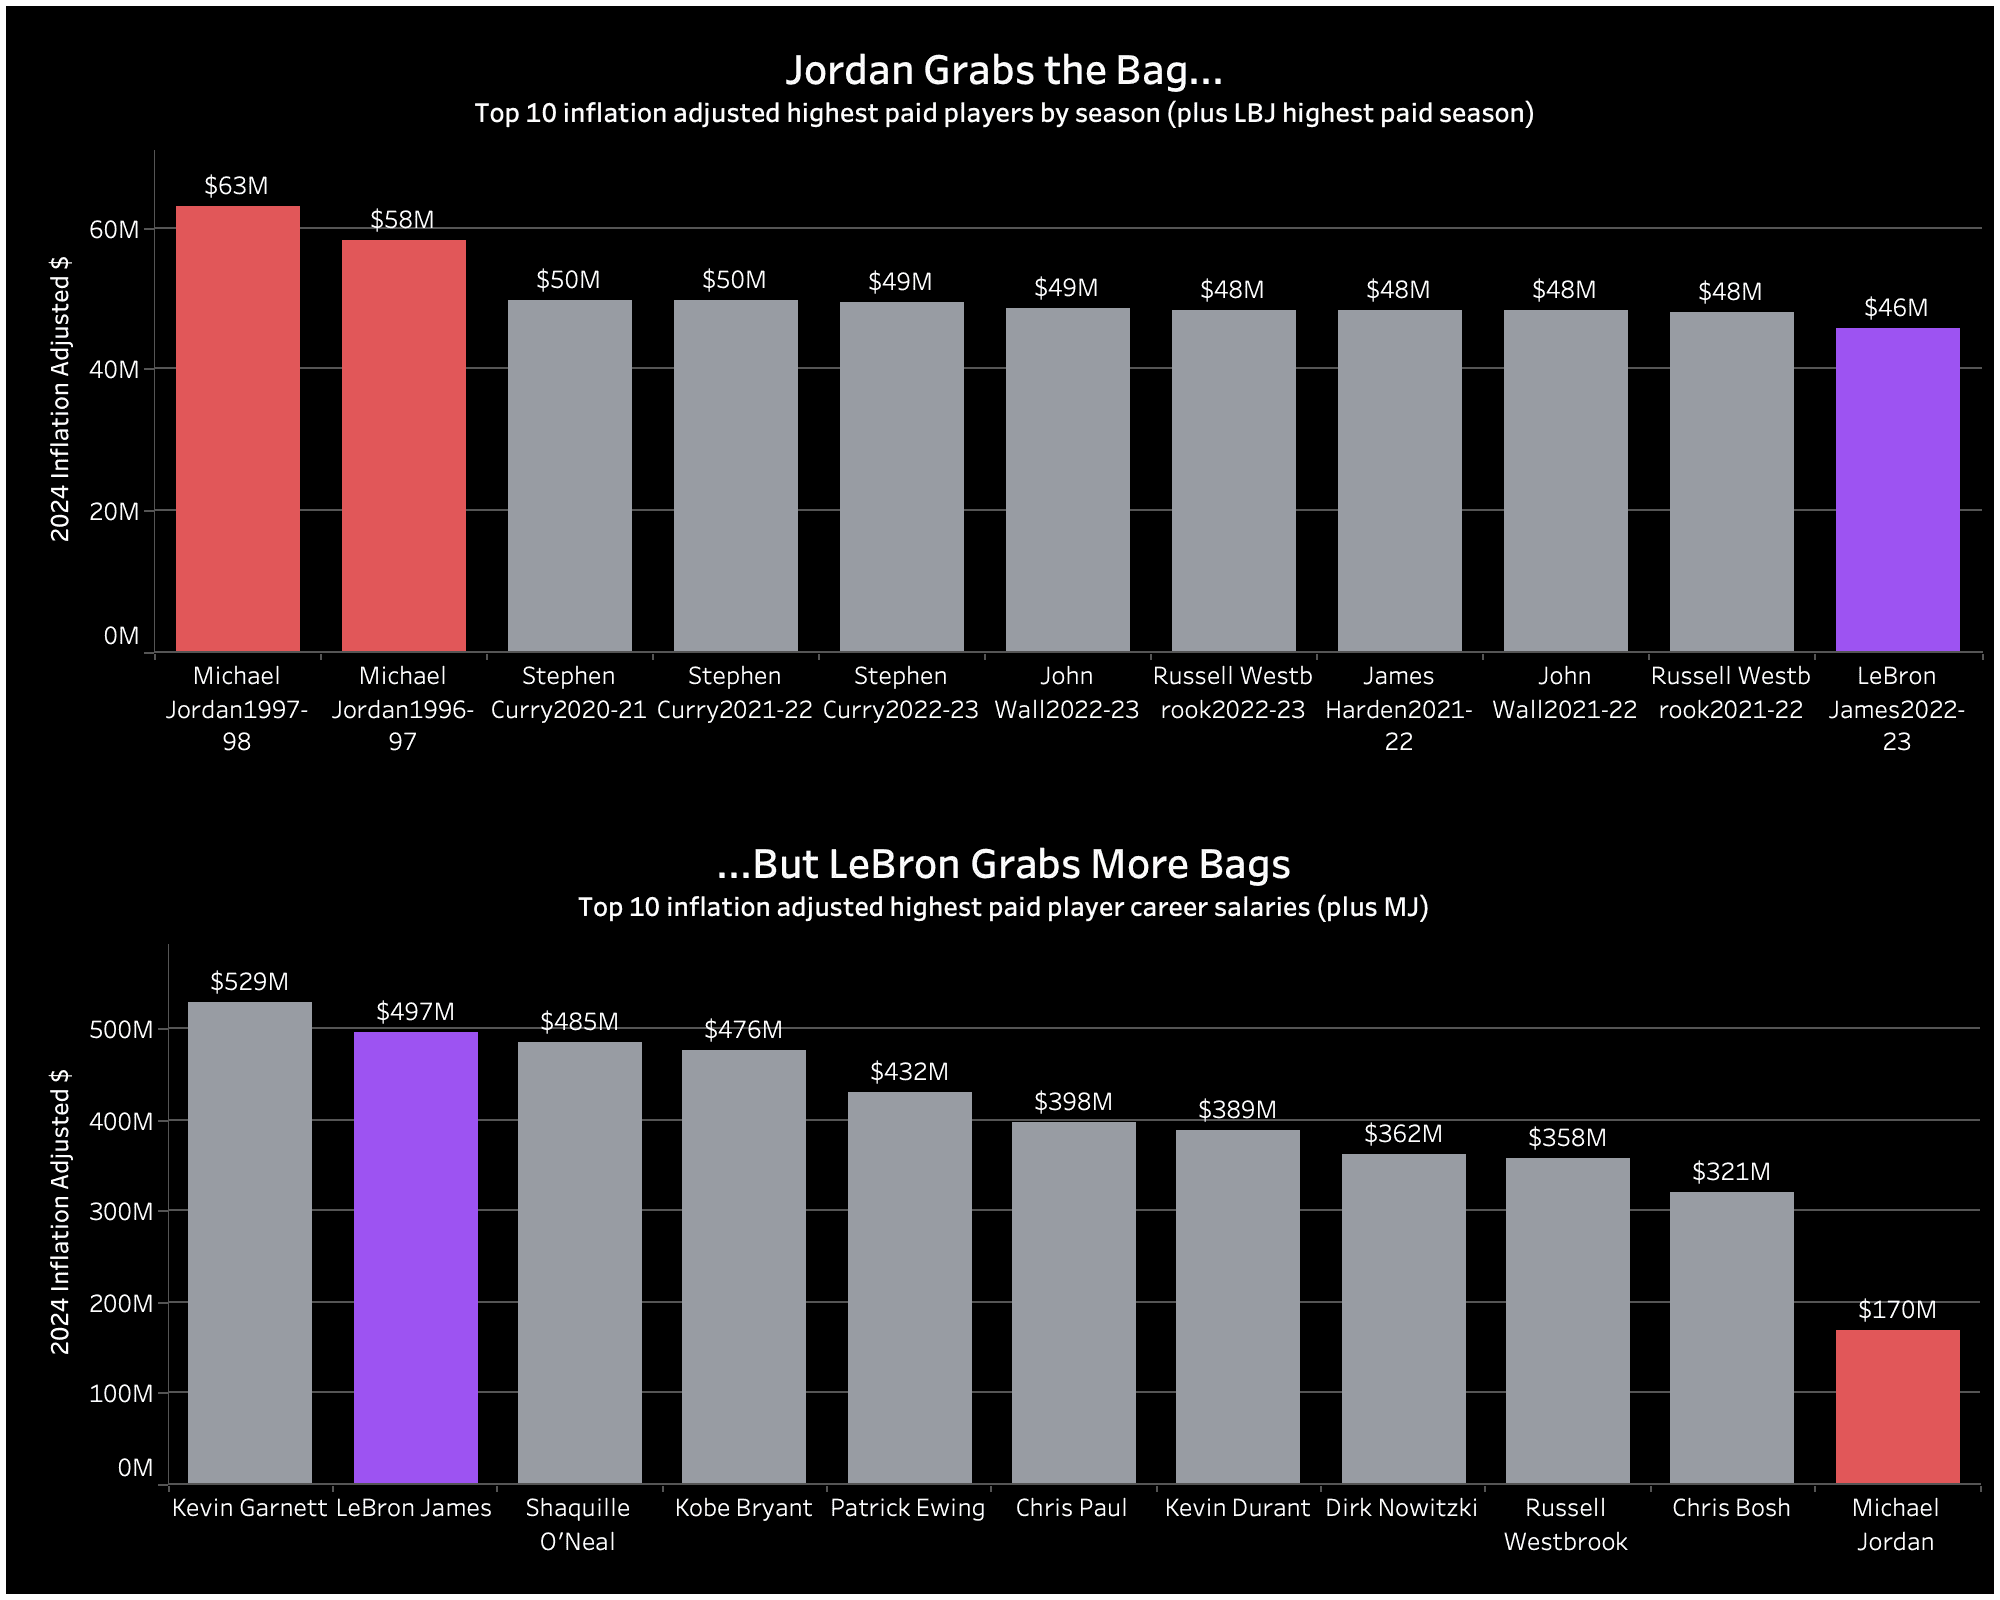
Insight: When we take inflation into consideration, it is clear Michael Jordan was, by far, paid more than any other player in NBA history for a single season... not once, but twice! What's perhaps more surprising is despite this, LeBron James has accumulated almost 3 times more in total salary pay over his career — and counting. This was achieved through the longevity of career, LeBron James has (currently) played 21 seasons in the NBA, compared to Michael Jordan's 15, as well as consistently earning a high, yet not record-breaking salary year-on-year. Despite Michael Jordan's two astronomical salaries in the 1996-97 and 1997-98 seasons, he only averaged $11m a year in NBA salary, compared to LeBron James's $24m.
Approach: Started with stg_extra_hist_inflation.sql and stg_player_salaries_by_season.sql. Calculates the average value of the dollar for each NBA season to adjust for inflation in intermediate model player_salaries_adjusted_for_inflation.sql.
Key average game career statistics
Here are a few of the critical metrics that represent a player's performance in games over their career. Note, the '*' next to the Other legend means: any other NBA player who had played an average of 25 minutes per game during their career.
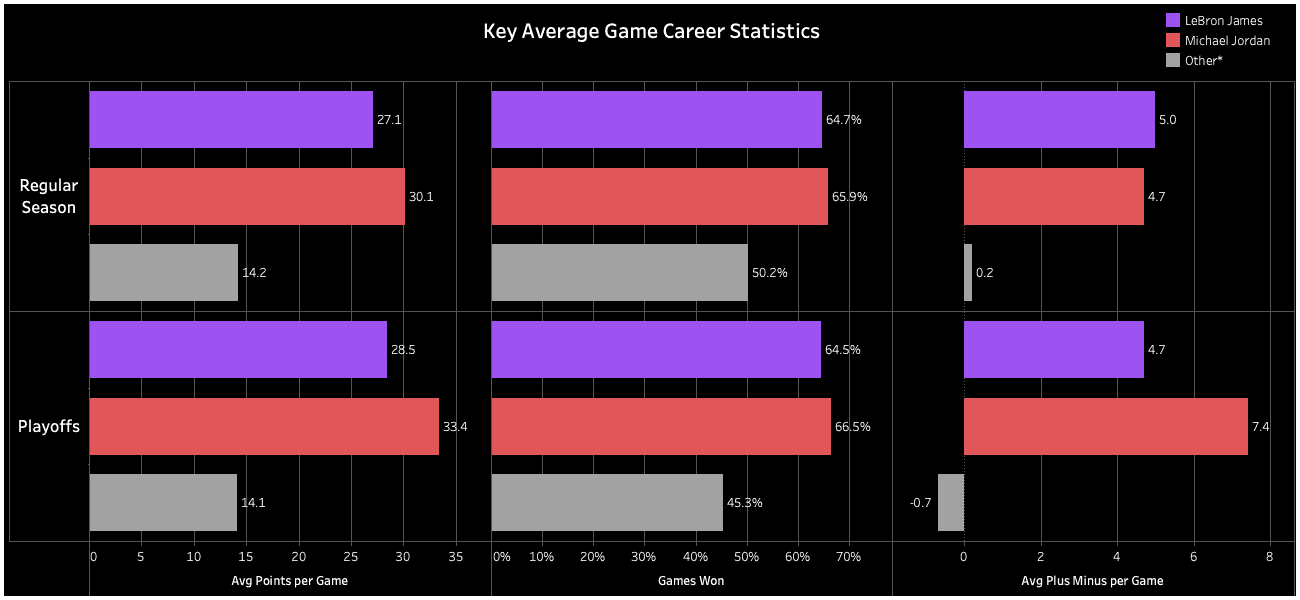
Insight: Michael Jordan outperforms LeBron James in key basketball metrics. In regular-season games, Jordan averages more points per game and a higher win percentage. In playoffs, Jordan's performance escalates significantly, with 17% more points per game, 3% more wins, and an impressive 57% higher average plus-minus per game compared to LeBron James.
Approach: Starting with stg_player_game_logs.sql, I calculated season averages of various statistics in player_career_avg_game.sql. Next, I build fct_player_career_performances.sql to examine LeBron’s career vs Michael Jordan.
If you found these insights interesting, check out additional insights in my Github’s README.md!
Where to go from here
Looking back on my time in the NBA Data Modeling Challenge, it sharpened my analytical abilities and increased my understanding of how data influences basketball strategies. And of course, it was a great opportunity to compete!
Looking forward, Paradime’s got something exciting on the horizon: a challenge centered around Movies data in April. It’s a shift from basketball to the big screen, and honestly, I can’t wait to see what we can uncover within movie datasets. There’s something special about diving into the numbers behind the stories we love on screen. So, if you’ve got a knack for data and love movies, this is your chance to explore, learn, and compete for the $500, $1,000, and $1,500 prizes!