Movie Challenge Rewind: Hollywood Economics
From historic blockbusters to inflation-adjusted earnings, Anton Goncharuk reveals the money-side of Hollywood.

Anton Goncharuk
Jul 11, 2024
·
4
min read

Introduction
Hey there! I'm Anton Goncharuk, Principal Analytics Engineer at Hubspot. I’ve been using dbt™ since early 2019, so when I discovered Paradime’s Movie Data Modeling Challenge, I couldn't resist the chance to participate!
If you aren't already familiar with Paradime’s Movie Data Modeling Challenge, check out this blog for a brief overview!
In this blog, I'll share insights about my challenge submission, including the journey of building my project, the movie insights I uncovered, and how I used Paradime to bring my project to life. Enjoy!
Building My Project
Every data professional knows that uncovering insights is just the tip of the iceberg. Before reaching that point, countless hours are spent brainstorming, building a project plan, overcoming data issues, and hitting dead ends. Here’s a quick summary of my project-building process:
Project Strategy: I started the project by diving deep into the movie datasets. My main goals were to understand the historical movie datasets and build a state-of-the-art data infrastructure that delivers clean, validated data for BI layers. I aimed to create a dbt™ project that could serve multiple use cases, prioritizing data governance and reliability over flashy BI presentations.
Challenges Faced: One of the significant challenges was dealing with inconsistent data from various sources. For example, TMDB and OMDB had wildly different revenue figures for the same movies. Without a business team to guide me, I had to make several assumptions on my own. Usually, there are business teams to tell you what to prioritize. For this challenge, I had to decide on my own.
Key Learnings: This project reinforced the importance of balancing backend infrastructure with the final presentation layer. While I focused heavily on data governance, I realized the final BI layer often captures more attention. This experience underscored the need for both solid data management and compelling data storytelling.
Execution Process: Throughout the project, I used SQL and dbt™ within for modeling and Lightdash for visualization. Paradime’s tools, especially the Lineage feature, were crucial in keeping my workflow organized. I leveraged the CLI for quick YAML file generation and used the Data Preview for sanity checks, ensuring my models produced accurate results.
Overall, this project was a blend of tackling technical challenges, learning new tools, and reinforcing the importance of clean, reliable data in analytics.
Insights Uncovered
Below are some of the key insights I uncovered during the challenge, but can view my additional data insights and visualizations in my GitHub repo.
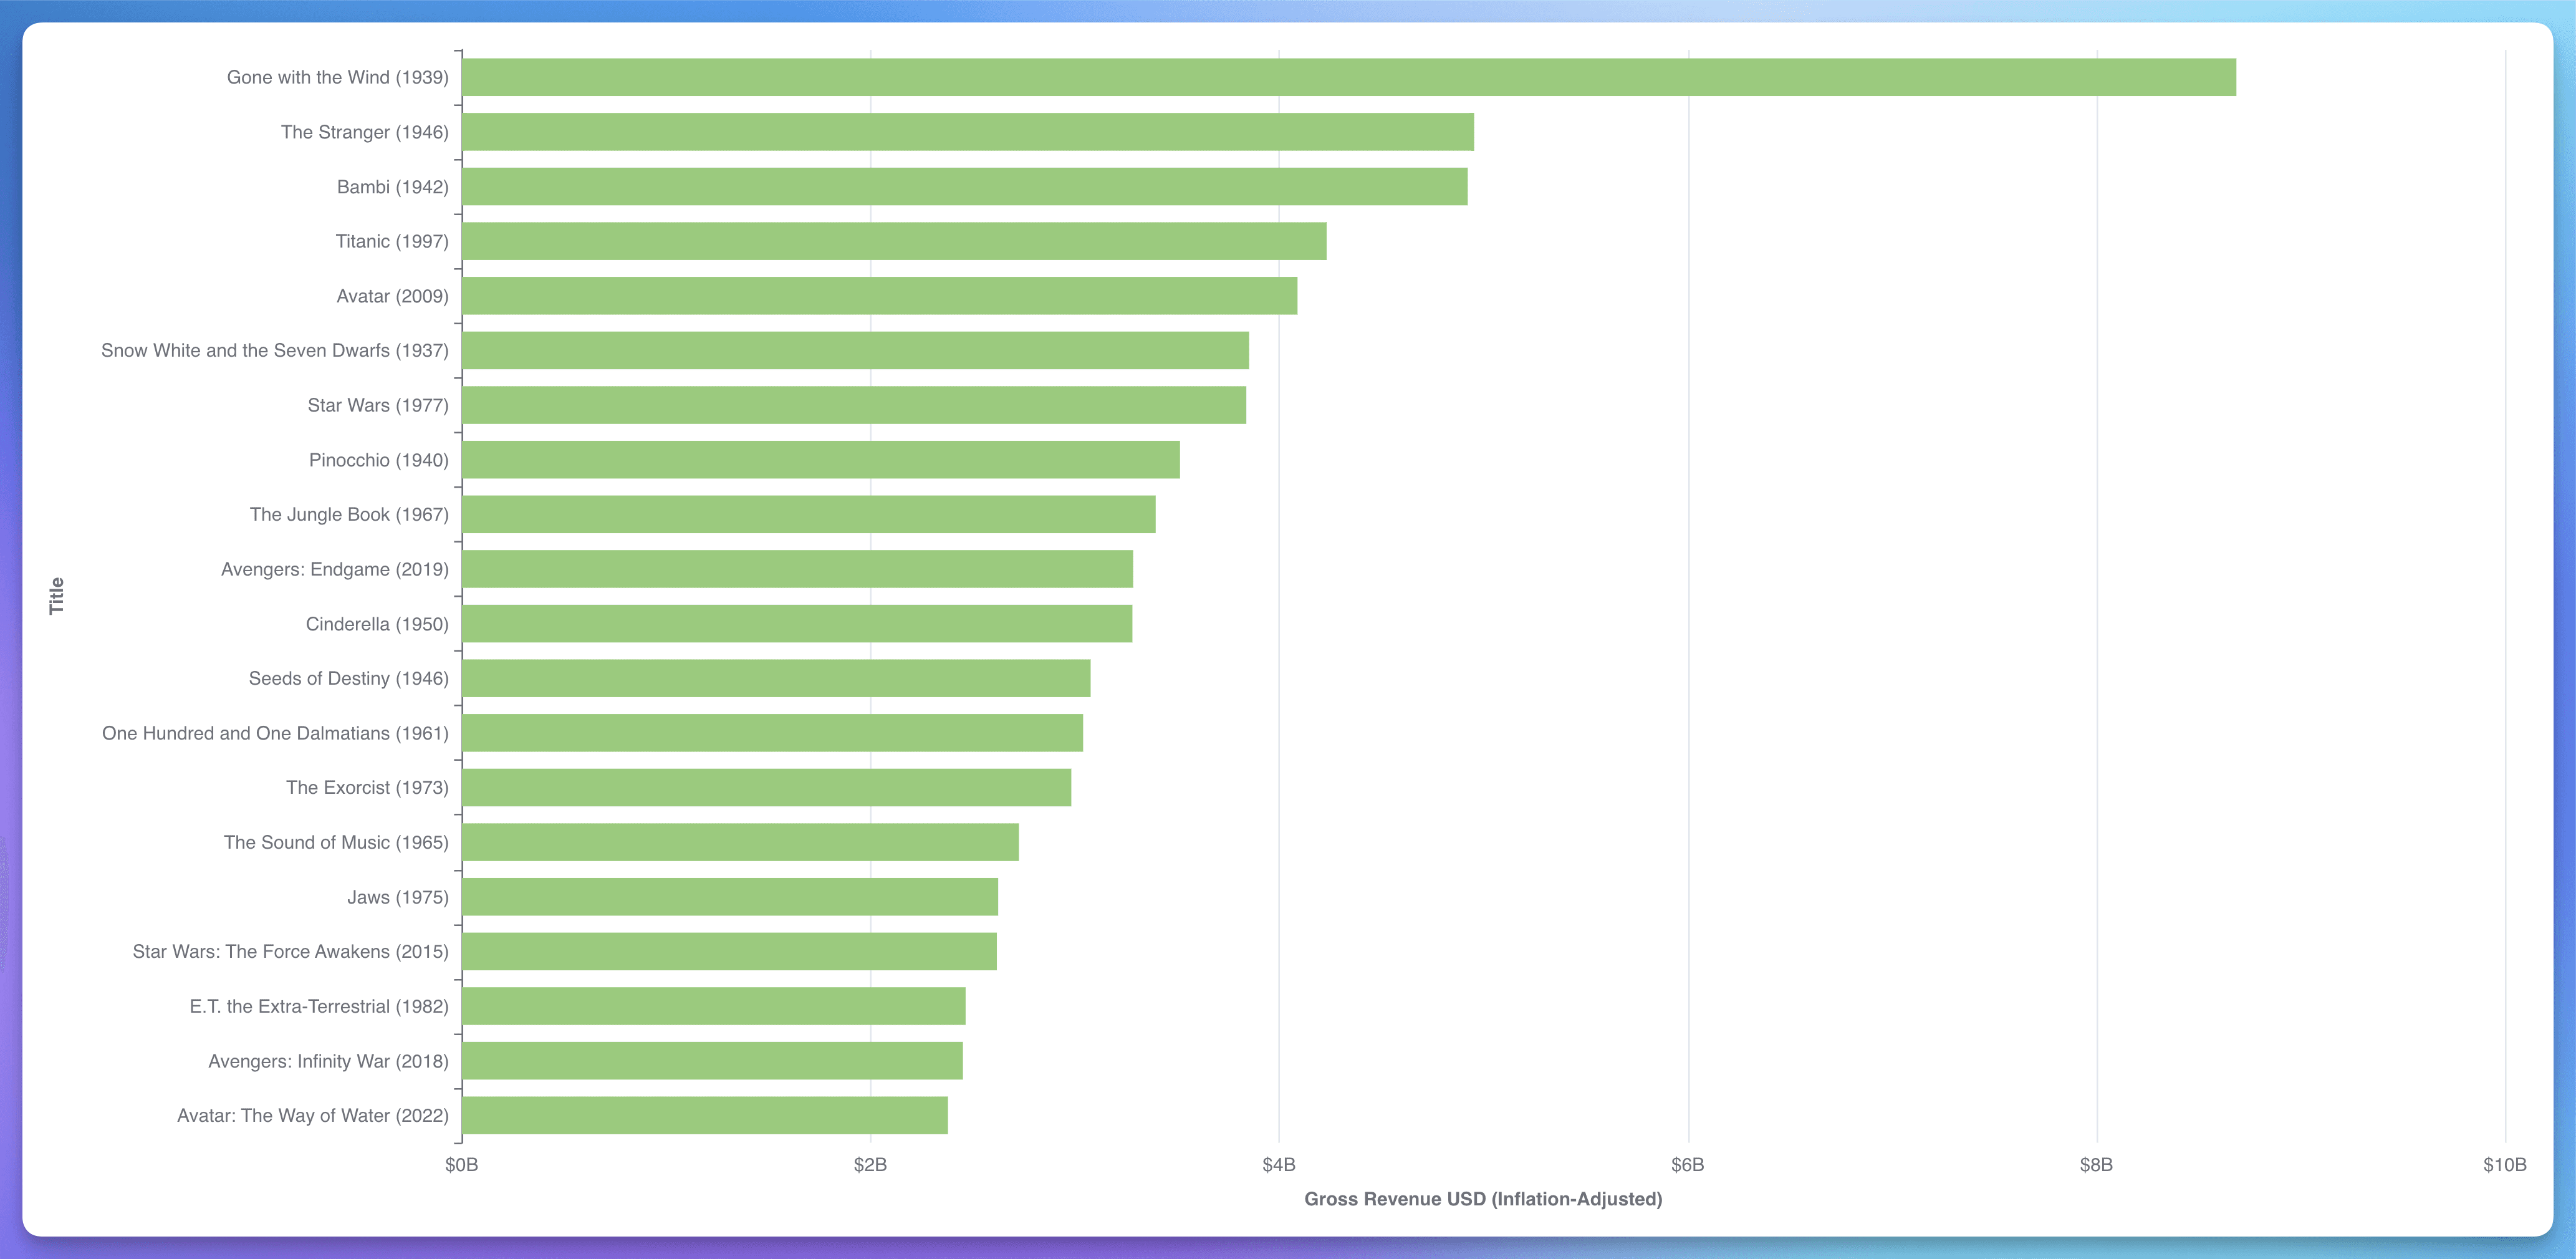
Insight #1: The Highest-Grossing Films of All Time
Gone with the Wind (1939) earned $402 million in box office revenue back then. Adjusted for inflation, that’s equivalent to $8.7 billion in 2024. This insight helps contextualize historical data within modern economic conditions, providing a clearer picture of a movie's true financial success.
Approach: I started by creating int_inflation_adjustments__yearly.sql to compute CPI ratios, allowing me to adjust financial figures for inflation. Next, I built int_tmdb_media.sql to consolidate and enrich TMDB movies. After that, I merged this enriched dataset with OMDB data in media.sql, prioritizing TMDB data for accuracy.
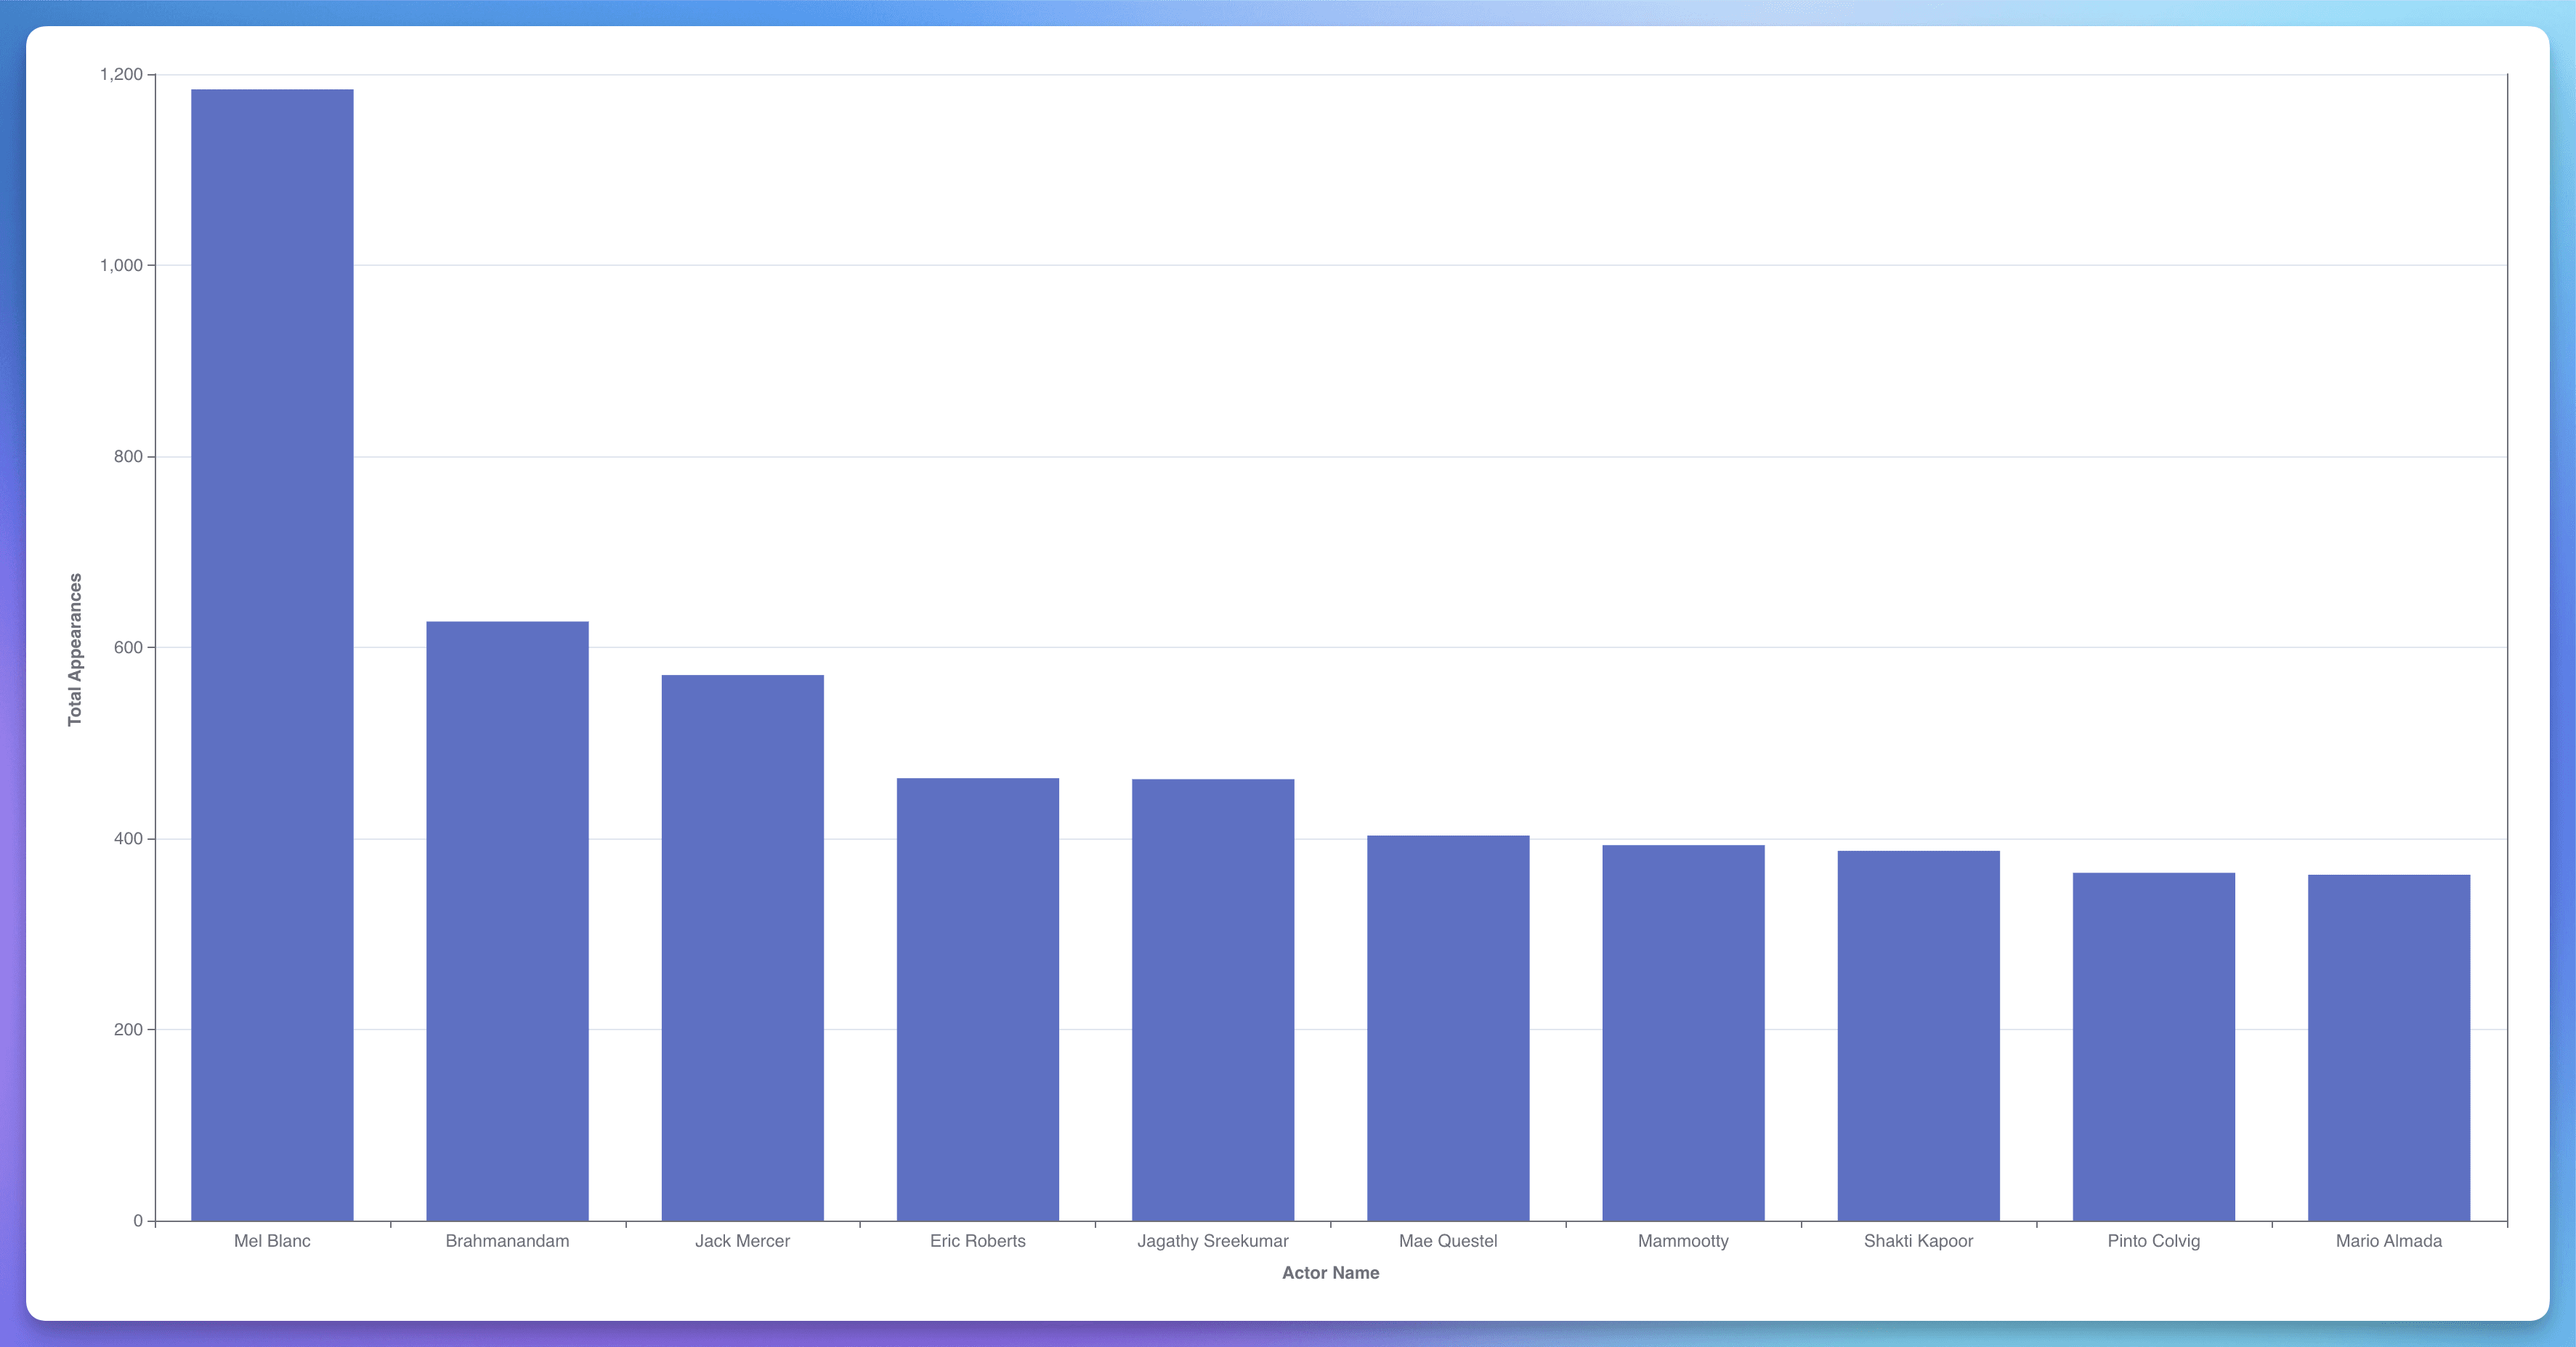
Insight #2: Top 10 Most Appearing Actors of All Time
Mel Blanc, known as "The Man of a Thousand Voices," is one of Hollywood's most prolific actors, with over a thousand screen credits. He created and performed nearly 400 distinct character voices, becoming renowned worldwide for his work in radio, television, cartoons, and movies.
Approach: I first processed IMDb principals data in stg_imdb__principals.sql to extract actor roles and characters. Then, I enriched this data with actor details using stg_imdb__names.sql, obtaining full names and notable titles. Finally, in crew.sql, I merged these datasets, ensuring unique actor-role combinations to accurately count appearances and determine the top actors.
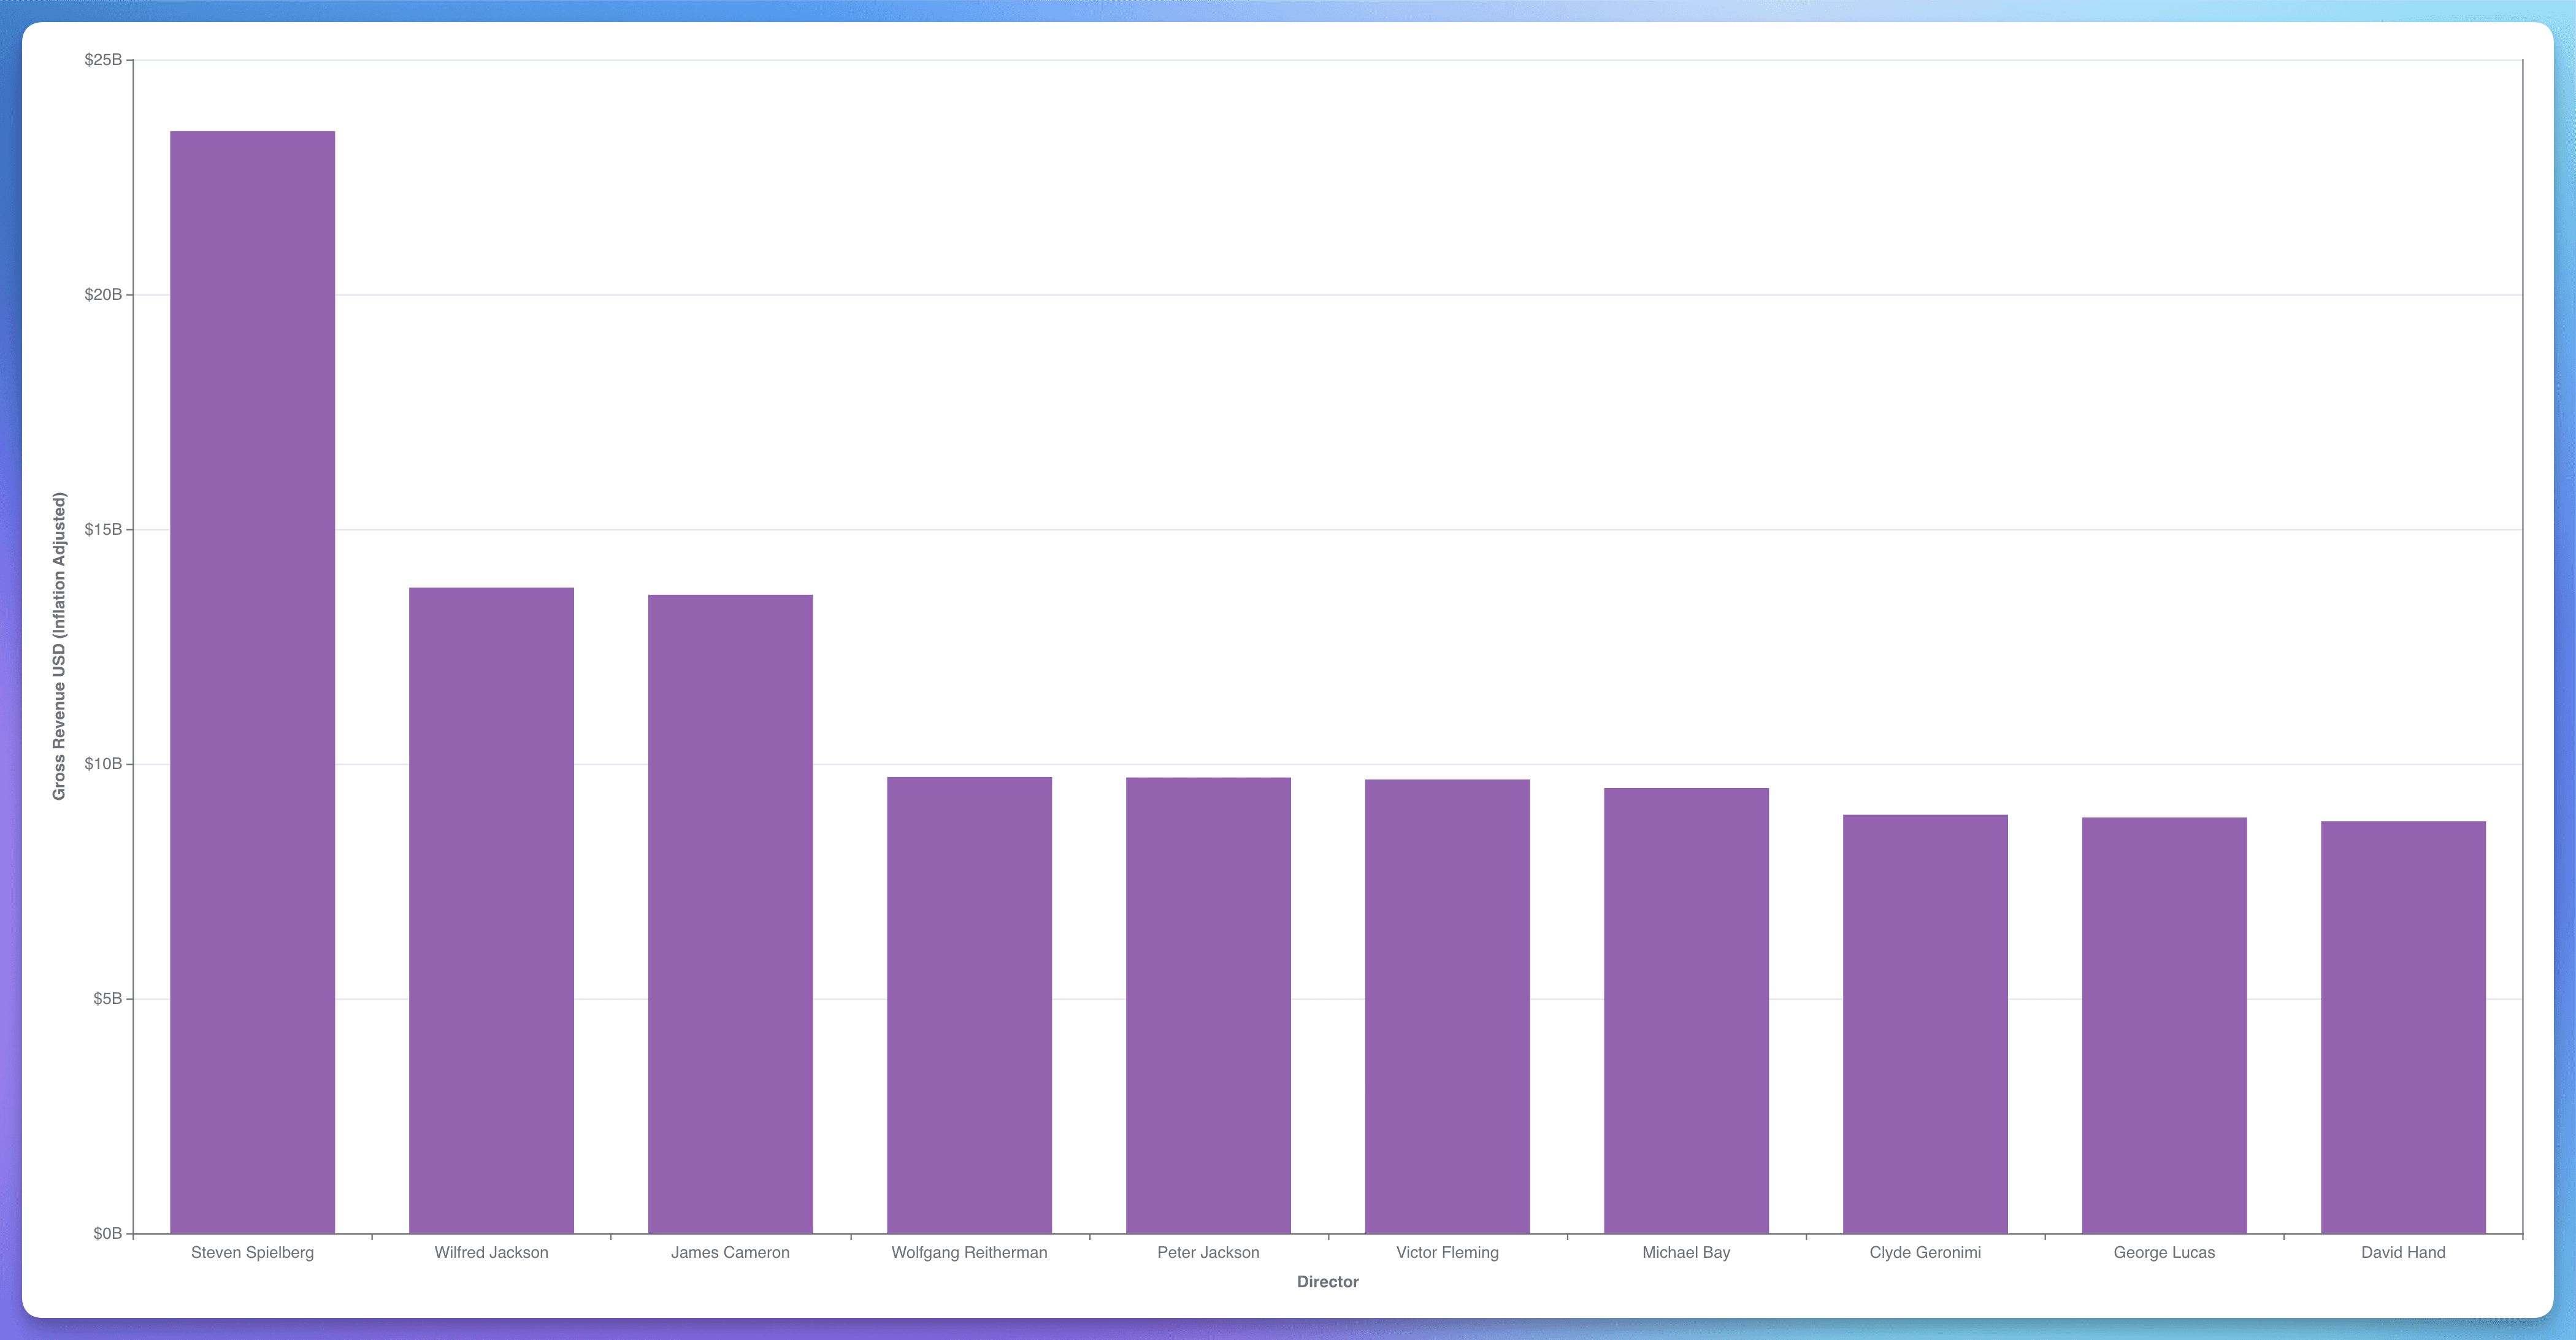
Insight #3: Top 10 Highest-Grossing Directors of All Time
Steven Spielberg is a legendary figure in cinema, directing iconic films like "Jaws," "E.T. the Extra-Terrestrial," and "Jurassic Park." His films have grossed immensely over the years, making him one of the highest-grossing directors of all time.
Approach: I used the same approach as “Top 10 Most Appearing Actors of All Time”, but afterward, I joined the table crew.sql with media.sql to identify the “Top 10 Highest-Grossing Directors of All Time.”
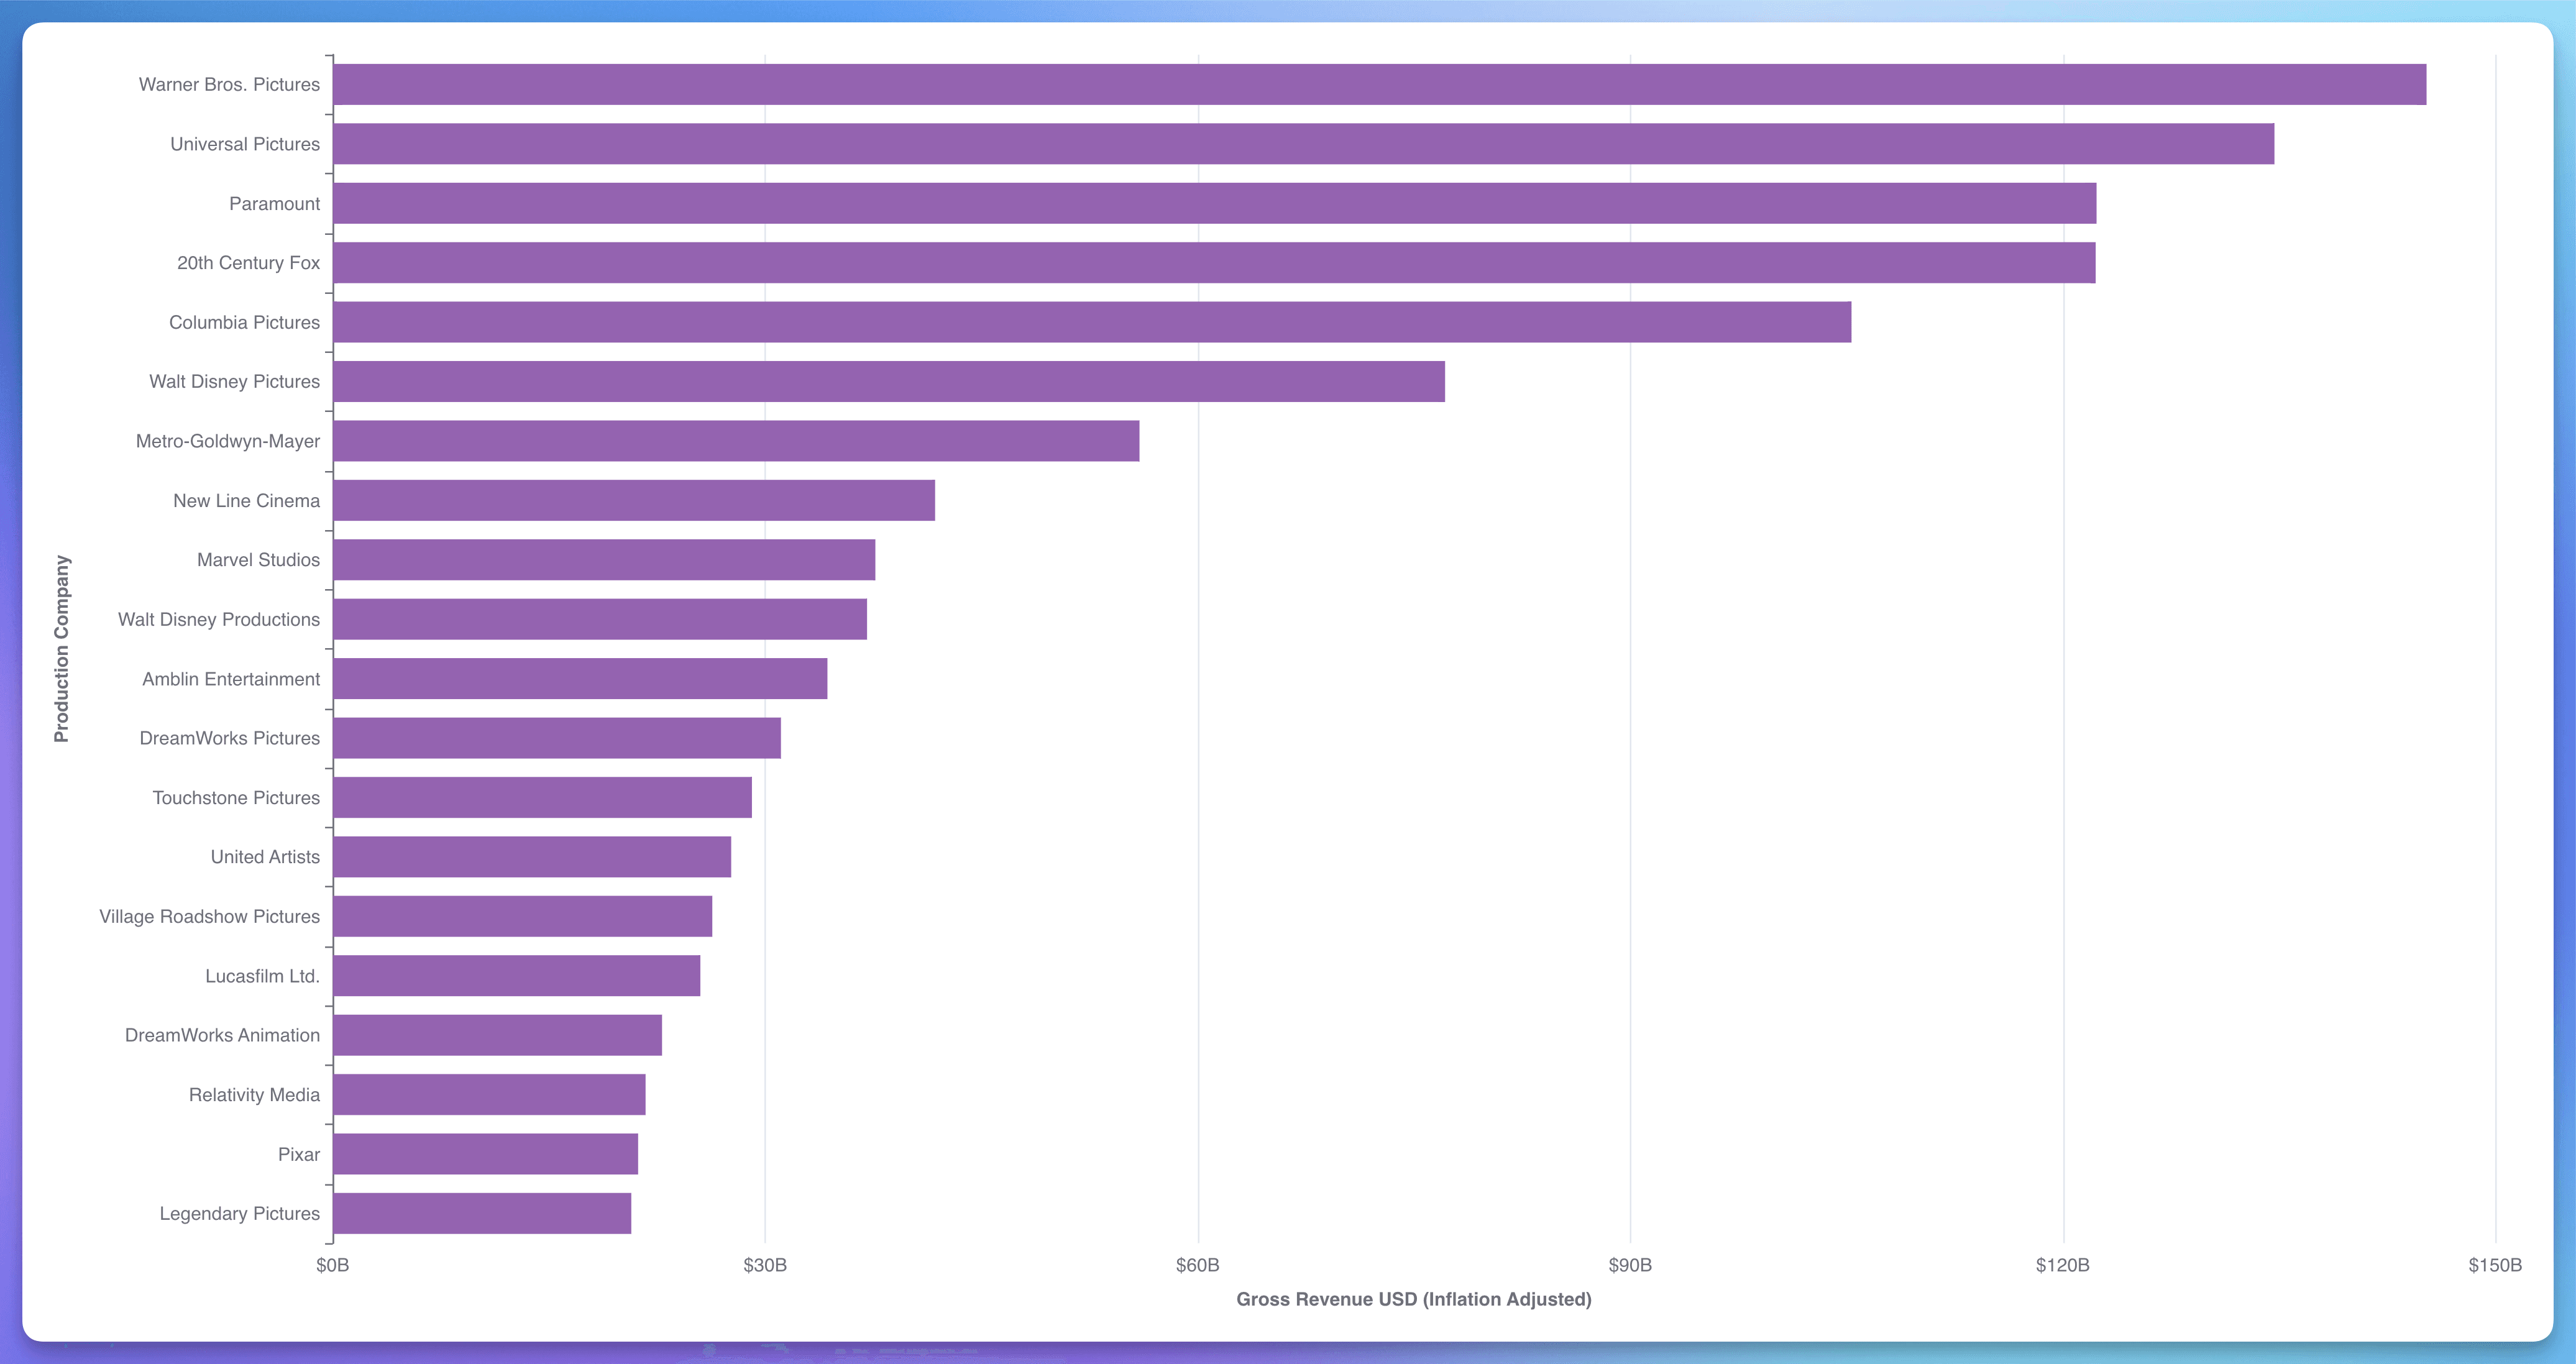
Insight #4: Top Money-Making Production Companies
Although this doesn't directly relate to Profit or Return On Investment (ROI), Warner Bros. Pictures appears to be a leader in the movie production industry based on gross revenue (box office), the total number of movies produced, and the number of Oscars their movies have received.
Approach: I developed int_tmdb_media.sql to consolidate movie data from TMDB. Next, I used media.sql to adjust financial figures for inflation, and produce a comprehensive, unified dataset of movie details.
My Paradime Stand-Outs
Paradime was obviously instrumental in my project, offering several features that enhanced my workflow and overall project quality. Here are the three key features that stood out:
Data Lineage Preview: This feature allowed me to see the end-to-end data flow from the source to the BI layer. It helped me visualize the entire data process, ensuring no redundant logic and maintaining a streamlined project. By using the Lineage feature, I could track how data moved through various transformations and models, making it easier to troubleshoot issues and optimize my workflow. This visualization was crucial for maintaining data integrity and ensuring that the logic was not duplicated unnecessarily.
Integrated Terminal (CLI): As a heavy CLI user, having robust CLI within Paradime made my workflow much smoother. I could quickly generate YAML files, automate repetitive tasks, and seamlessly integrate various Python packages. The CLI allowed me to execute commands efficiently, which sped up the development process. For example, I used the CLI to create and manage dbt™ models, run tests, and generate documentation. This integration kind of bridged the gap between Paradime and my usual development environment, making the transition almost effortless and allowing me to leverage my existing skills.
Data Preview: This feature was essential for performing quick sanity checks on my developing models. It allowed me to verify that the results matched at every step, ensuring accuracy and reliability. I really like how the Data Explorer provided a user-friendly interface fore querying and inspecting data, which was really useful when developing and refining my models. I used it to validate transformations and ensure that the data output was as expected, which helped catch errors early and maintain high-quality data throughout the project. The explorer By allowing for immediate feedback, the Data Explorer was invaluable in maintaining the project's overall integrity.
Wrap Up
The Movie Data Modeling Challenge was super fun, balancing data infrastructure and BI presentation. Paradime's features, especially Lineage and CLI, were game-changers. I tackled inconsistent data and learned the importance of data governance.
Thanks to Paradime, Lightdash, and the community for this awesome experience. Excited for future challenges, I’ll definitely join again… and so should you!