Movie Challenge Rewind: Plotting Movie Popularity
Discover the 2nd place winner's insights and best practices from the Movie Data Modeling Challenge!

Rasmus Sørensen
Jul 12, 2024
·
4
min read

Welcome to the "Movie Challenge Highlight Reel" series 🙌
This blog series will showcase the "best of" submissions from Paradime and Lightdash's Movie Data Modeling Challenges, highlighting the remarkable data professionals behind them.
If you're unfamiliar with the Movie Data Modeling Challenge, enrich your series experience by exploring these essential resources: the challenge introduction video and the winner's announcement blog. They offer valuable background information to help you fully appreciate the insights shared in this series.
In each "Movie Challenge Highlight Reel" blog, you'll discover:
Key Movie insights: Uncover the valuable insights participants derived from historical Movie datasets, revealing scroll-stopping insights about movies, actors, directors, production companies, finances, and more.
Analytics Engineering best practices: Learn about the participants' approach to project execution, from initial analysis to final insights, including their coding techniques (SQL, dbt™) in Paradime.
Now let's check out our second installment, exploring Rasmus Engelbrecht Sørensen and his submission!
Introduction
Hey there! My name is Rasmus, and I'm a lead product data analyst at Lunar, a digital bank based in Copenhagen, Denmark. I recently competed in Paradime's Movie Data Modeling Challenge, and I'm proud to say I took second place, winning the $1,000 prize!
In this blog, I'll start by sharing a few insights I uncovered, and then I'll dive into how I built my project and how I used Paradime to make it all happen.
Insights Uncovered
Below are three of my favorite insights I uncovered, but you can check out the rest in my GitHub README.md file.
Top 20 Most Popular Actors
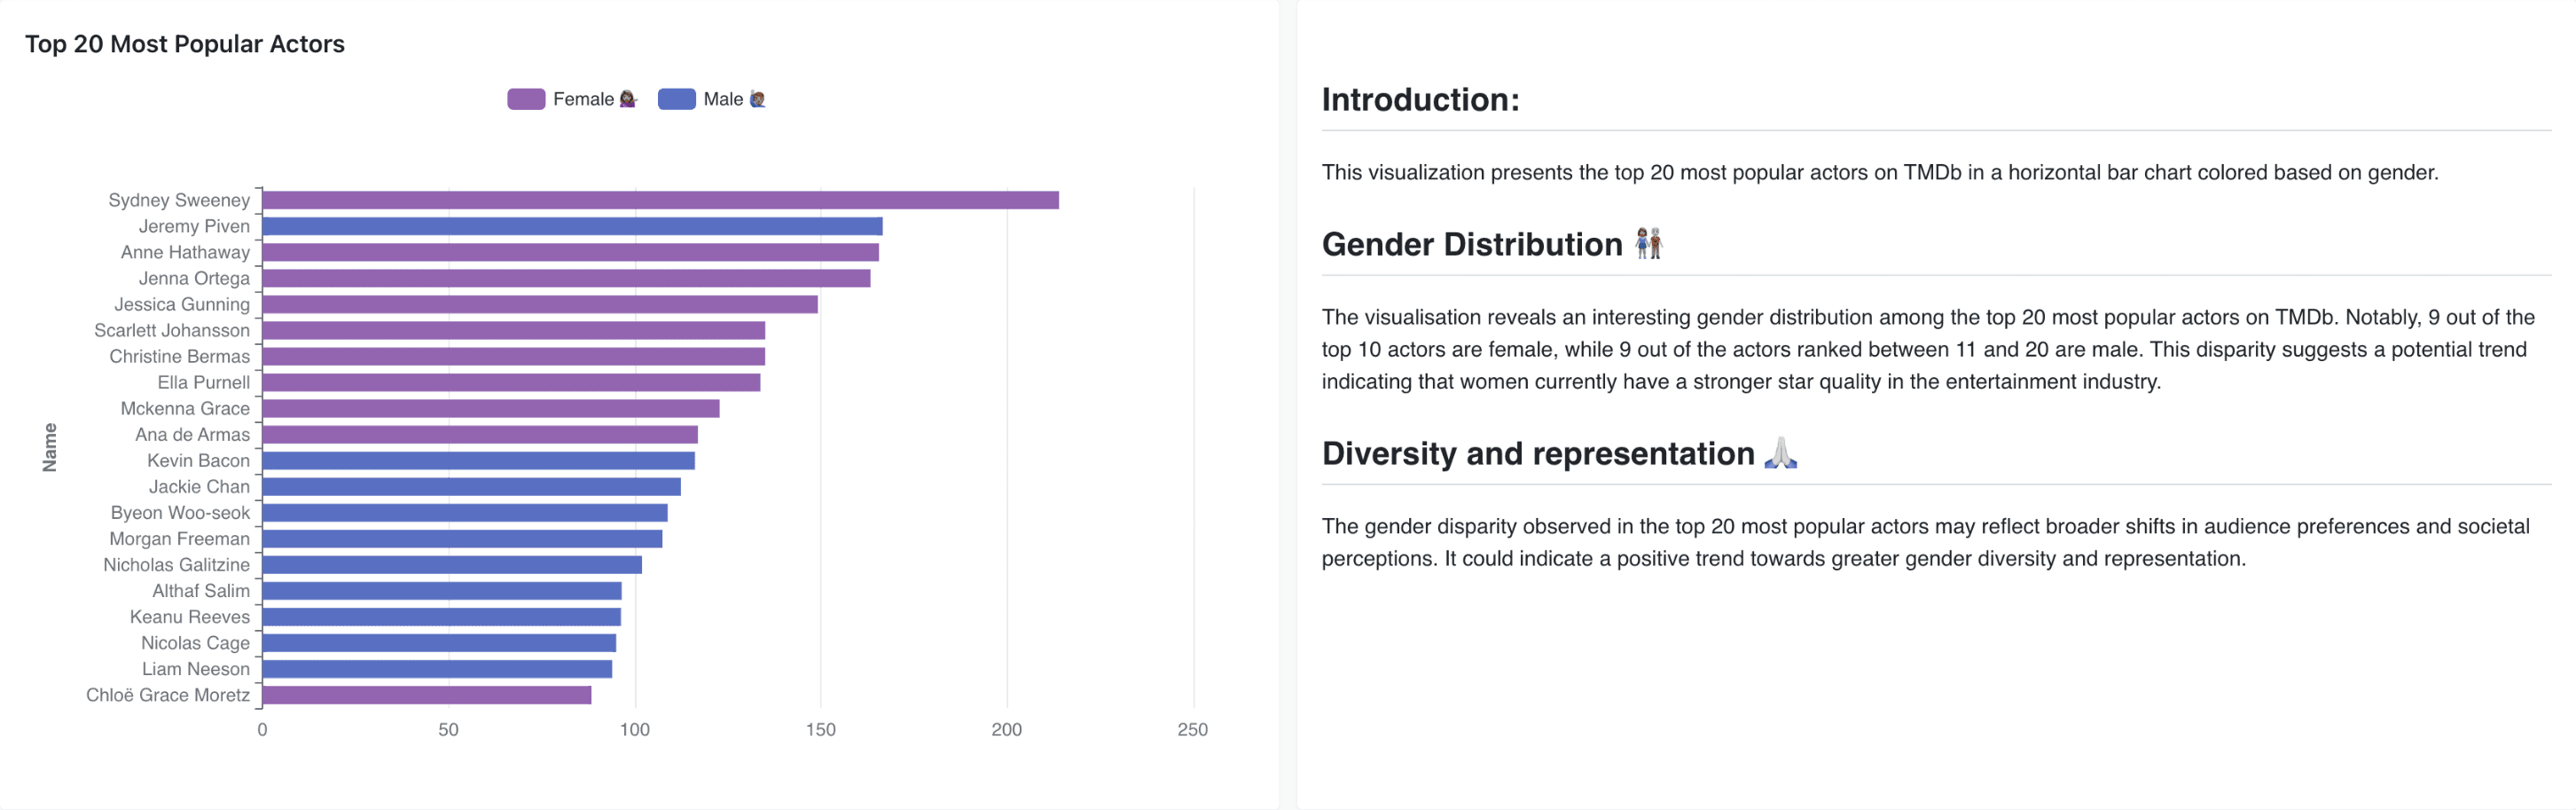
Approach: Using Mage, extracted popular people from the TMDB API. Popularity is based on each actor's page view count on TMDB. To prepare my insights for BI, I identified male and female actors in popular_people.sql
Distribution of Top 15 Keywords by Year
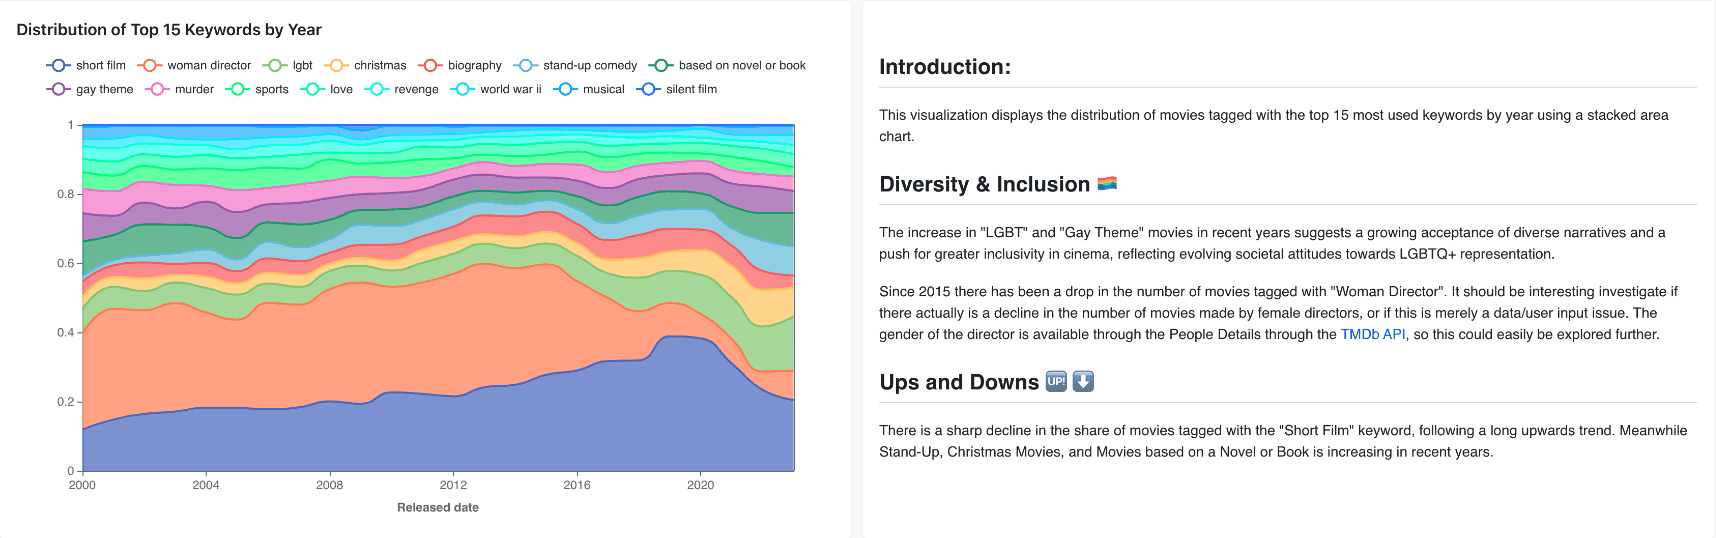
Approach: In int_movie_keywords.sql, I unnested keywords for each TMDB movie using Snowflake's split_to_table function. Next, I grouped each keyword by year to identify trends.
Correlation between TMDB & IMDB Ratings
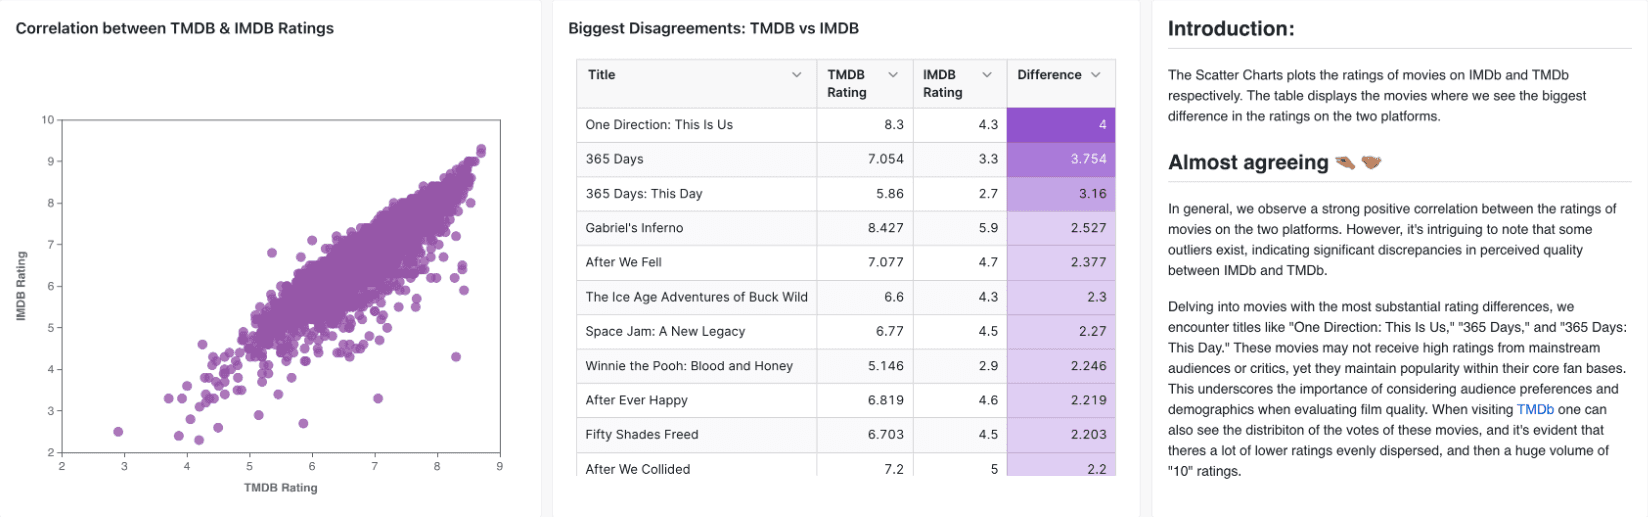
Approach: I joined two key datasets, TMDB and IMDB, in int_movies_enriched.sql. Next, I created a calculation to identify movies with the largest rating discrepancies.
Building my project
I started my project by exploring the provided datasets in Snowflake. I wrote a list of 10-20 analyses I could conduct. Next, I tackled data quality; I wanted to know what data was missing and/or incomplete before I narrowed down my analysis.
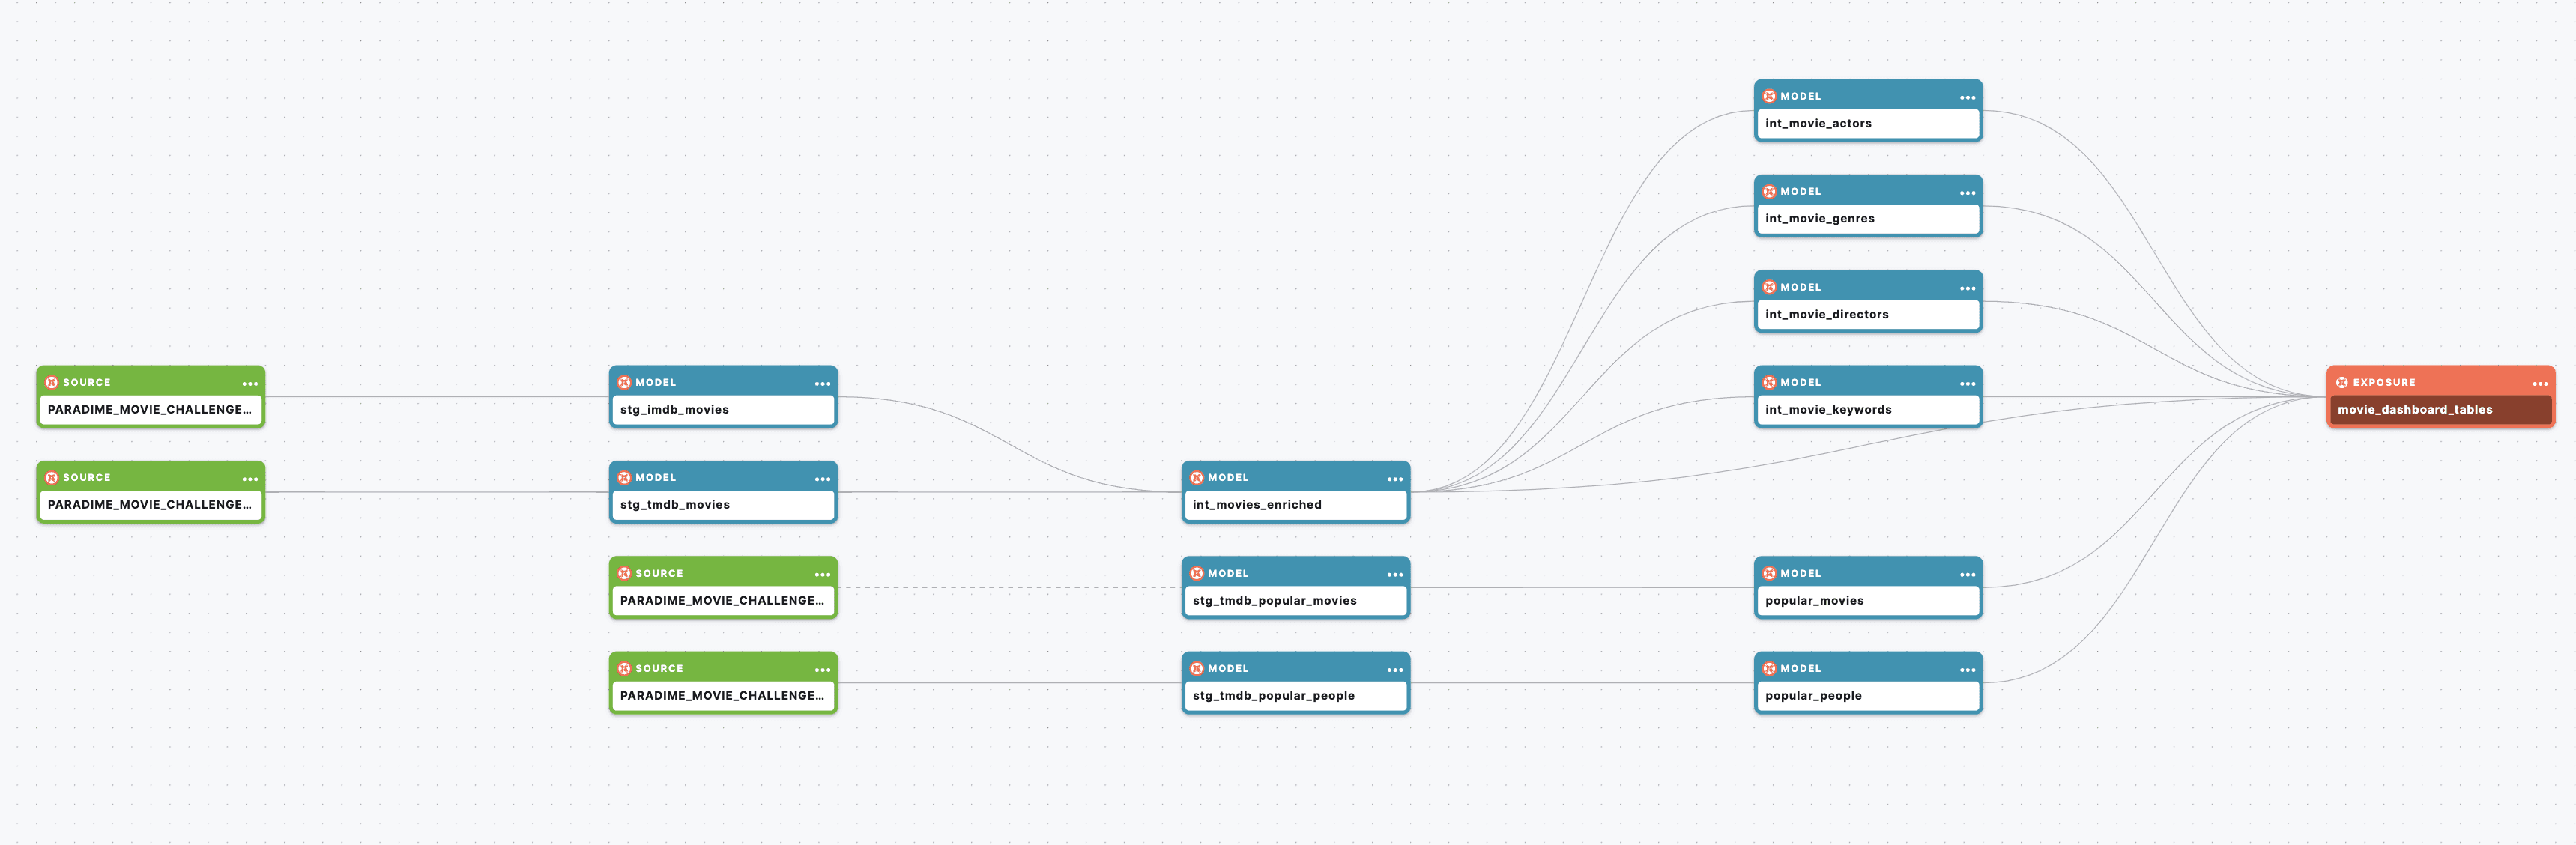
To efficiently manage my dbt project, I created an exposure in my marts. yml file to define the schema and join relationships of my final tables. This exposure ensured that I could dynamically query and combine data without needing to pre-aggregate everything in advance. See my data lineage for more details:
Eventually, I narrowed down my analysis to the following:
Which movie genres are the most popular?
Which actors are the most popular?
Which movies are the audience's favorites, and why?
How do the two major movie databases (TMDB, OMDB) compare and contrast?
For more info on how I build my project, check out my github repo, as well as my data lineage:
How I used Paradime
I have experience using dbt, but this was my first time using Paradime. The platform is incredibly easy to use, and I found two features particularly beneficial:
Data Explorer
Within the code IDE, I could preview my dbt models without having to first compile my dbt™️ resources. It allowed me to explore the results of my models throughout development and avoid executing dbt commands unnecessarily.
Lightdash integration
Through Paradime's integrated terminal, I was able to seamlessly connect to my Lightdash project for data visualization. It made the whole process of generating metrics and updating .yml files more efficient.
Other methods to get insights, like connecting a dbt project to Looker, are far more time-consuming and difficult than the Paradime + Lightdash integration.
Wrap Up
I really enjoyed participating in Paradime's Movie Data Modeling Challenge. It was a fantastic opportunity to compete, learn new tools, and improve my analytics engineering skills.
If you have any questions about my project or insights, feel free to reach out to me on LinkedIn!
Also, I highly recommend trying out Paradime for free!