Social Media Challenge Rewind: Insights and 'Insounds' of TikTok Audio Virality
Discover how Jayeson Gao uncovered TikTok audio virality insights, winning 2nd place in Paradime's dbt™ Challenge - Social Media Edition!

Jayeson Gao
Oct 15, 2024
·
4
min read

Welcome to the "Social Media Challenge Rewind" series! 🙌
This blog series showcases the "best of" submissions from Paradime's dbt™ Data Modeling Challenge - Social Media Edition, highlighting the remarkable data professionals behind them.
If you're unfamiliar with the Social Media Data Modeling Challenge, enrich your series experience by exploring these essential resources: the challenge introduction video and the challenge landing page. They offer valuable background information to help you fully appreciate the insights shared in this series.
In each "Social Media Challenge Highlight Reel" blog, you'll discover:
Key Social Media insights: Uncover valuable insights participants derived from social media datasets, revealing scroll-stopping stories about user behavior, engagement patterns, and global trends.
Analytics Engineering best practices: Learn about the participants' approach to project execution, from initial analysis to final insights, including their coding techniques (SQL, dbt™) and innovative use of tools (Paradime, MotherDuck, Hex).
Now, let's dive into our featured submission by Jayeson Gao!
Introduction
Hey! I'm Jayeson, a Sr. Analyst at Instacart based in the Chicago suburbs. I love storytelling with data and exploring where data and design intersect. Always eager to expand my technical toolbox, I jumped at the chance to participate in this challenge when I saw it on Reddit. Despite being new to dbt and initially viewing this as a skill-sharpening exercise, I found myself with just 10 days left and prizes on the line. I focused on crafting an engaging story about TikTok virality within a realistic scope.
With discipline and grit, my efforts paid off beyond expectations, resulting in a second-place finish and a $2,000 prize. More importantly, it provided an invaluable learning experience. This project allowed me to explore modern data tools, connect with other professionals, and witness the impressive creativity of fellow participants. Overall, it was an incredibly rewarding journey that pushed me to grow both technically and creatively.
Insights uncovered
To dive deeper into my submission, check out my GitHub repo and presentation. Here are a few of my favorite insights I uncovered:
1. Average # of Monthly Viral Videos & Viral Views by Rank Buckets
Across the top 100 leaderboards over 30 months, the difference between the top 10 and the rest of the top 100 was significant.
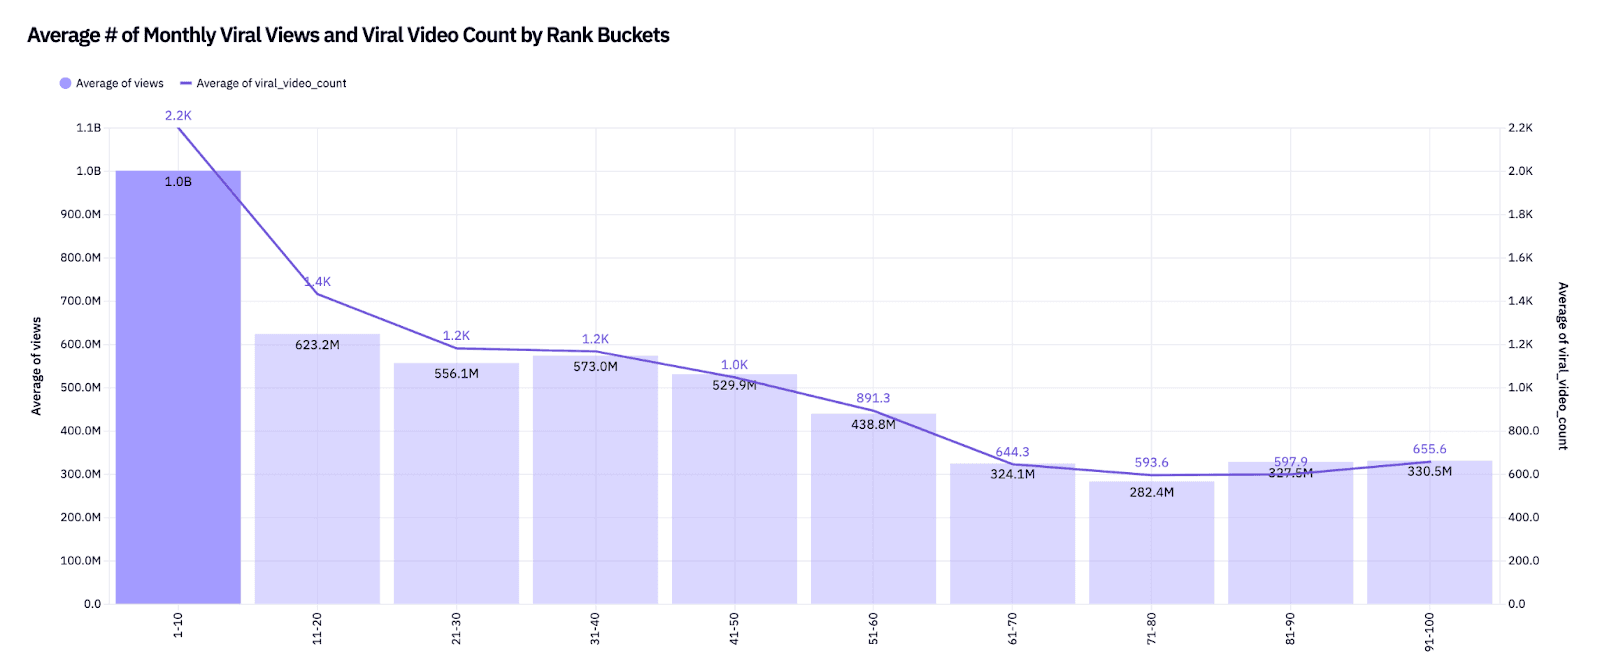
Approach: I bucketed all songs and song placements in mrt_tiktok_top_audio_by_month into ten buckets and averaged out virality stats across the 30 months.
2. Best Performing Audios by Viral Views
Covid-19 Blues? - Natalie Taylor's Surrender was the "best performing" audio using my scoring methodology on viral views. To find out who the final "best performer" and winner was based on both viral views and viral videos, check out my writeup or deck!
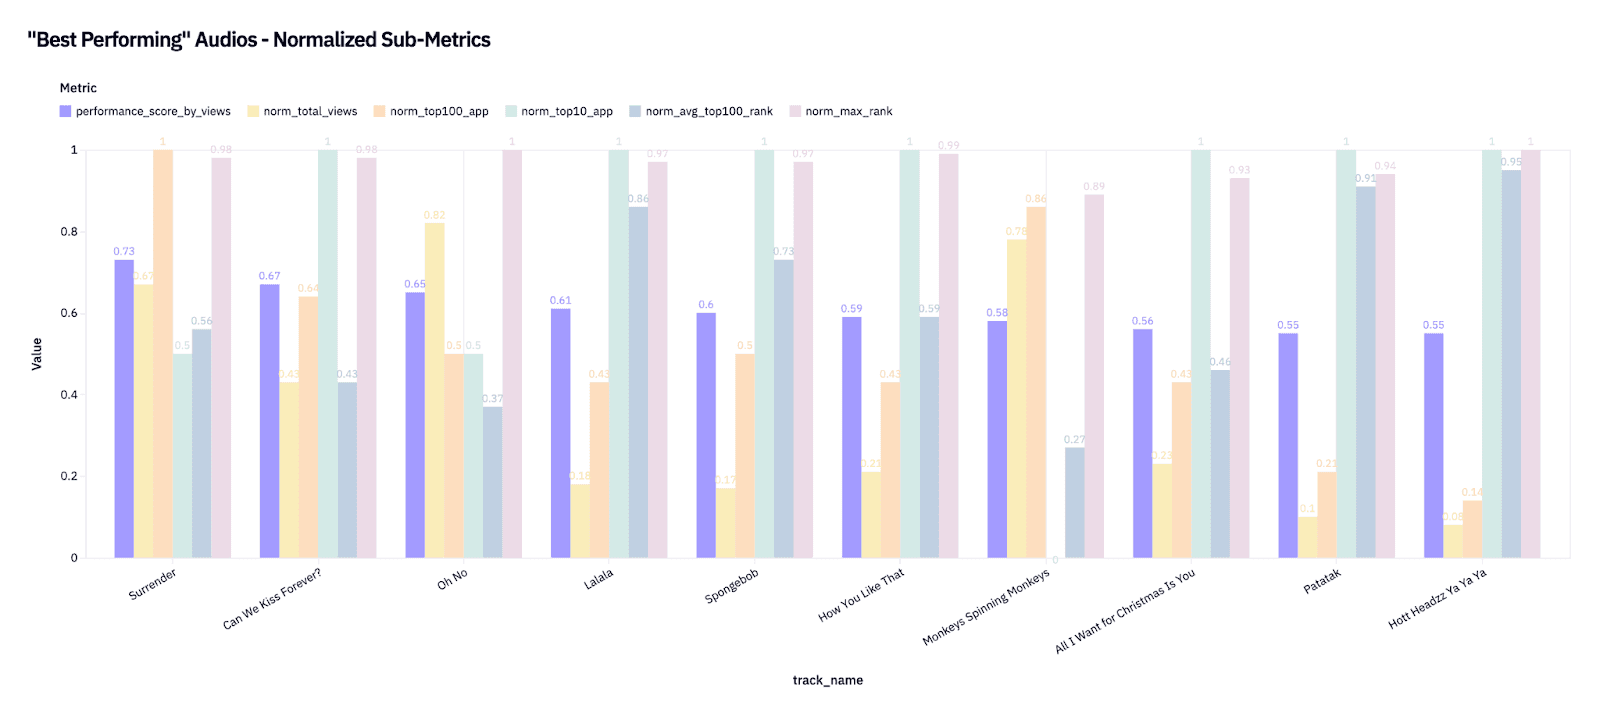
Approach: I created a normalized scoring methodology using 5 sub-metrics, combining gross stats and ranking stats. I also built a macro, performance_score.sql, within dbt to streamline these calculations.
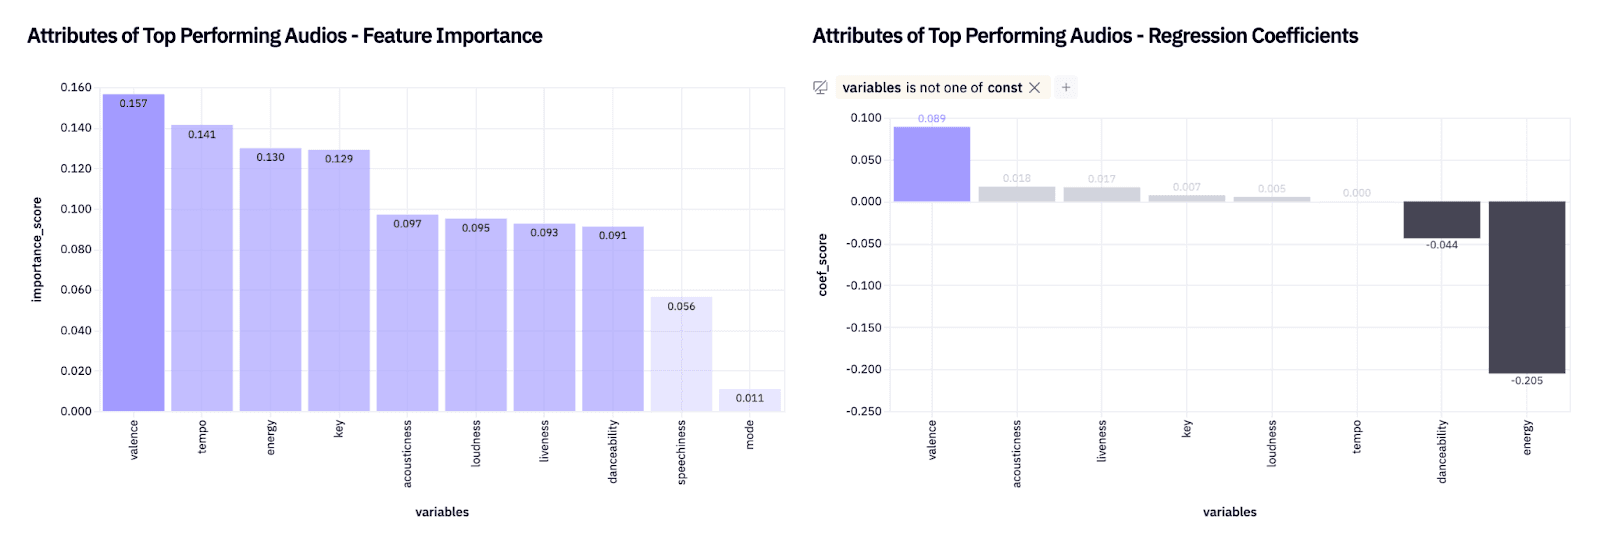
3. Attributes of Success
Using random forest to find importance scores and linear regression to find coefficient values, valence (musical positivity) proved to be the most important and impactful attribute.
4. MoM Rank Movements of the Final Top 10 by Views
In my bonus section, I looked at the rank movements by views over the 30-month period for the final top 10 songs. Mariah Carey's “All I Want for Christmas Is You “ (#9th overall; orange line) hit the charts every holiday season.
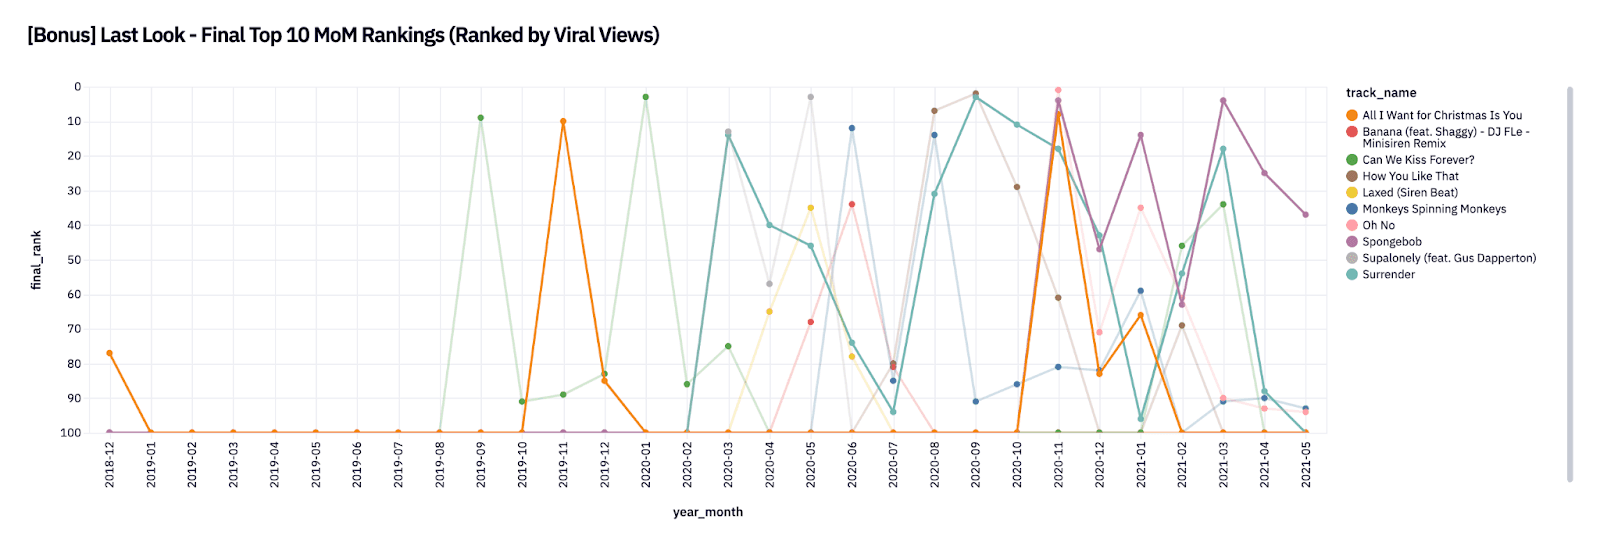
Approach: I built this chart using Hex's native line/scatter plot combo and by inverting the axis to go from 100 to 1.
Toolkit for success
To tackle this challenge, I used the following set of tools:
MotherDuck for Data Warehousing and Computation: Although I didn't utilize any fancy features, MotherDuck was incredibly easy to set up and use. I really enjoyed the instant SQL code fix and debug functionality.
Paradime for dbt Development: Being newer to analytics engineering, Paradime's platform and code editor made creating, testing, and deploying my models an extremely smooth and organized experience.
Hex for Data Visualization: Hex's notebook allows for analysis and visualization of both SQL queries and Python scripts, which made the analytics portion of the project super fun.
How I used Paradime
Paradime was especially handy and easy to use for dbt development. The following features were particularly useful:
Code IDE: The integrated Code IDE allowed me to use, run dbt commands, view the data lineage of my models in visual form, and preview / validate my tables (Data Explorer) all in one platform.
Documentation Auto-generation: Although I didn't exploit this feature as much as I could have, this feature allowed me to instantly create descriptions and metadata for model columns and have all of it reflected in the .yml files.
Where to Go From Here
This whole challenge, especially my experience with Paradime, made analytics engineering far more accessible than I initially thought. It was also a great opportunity to explore the functionalities and features of modern analytical tech stacks. Finally, I got to satisfy my own analytical curiosities with all the tools at my disposal to model and analyze data I was interested in. How often do you get to do that?
I highly recommend signing up for the next challenge, especially if you love projects as a way to learn, get lost in the 'analysis sauce', or showcase your engineering and analytical expertise!